The aim of the bullying index is to widen the definition of education quality, so it includes not just exam attainment but also the reduction of bullying in schools. The index now forms part of ONS’ public service productivity statistics. The ONS used Understanding Society and BHPS data on bullying to create the index, saying they are “recognised for their high quality”.
The BHPS (1991-2008) asked children how often they worried about being bullied, and Understanding Society, which started in 2009, asks them how often they are bullied (physically or in other ways). Both surveys also measure(d) children’s life satisfaction by asking them how happy they are with ‘life as a whole’ on a scale of 1 to 7.
The index works out the mean life satisfaction of students who reported being bullied, or worried about being bullied, and that of students who did not report any bullying, or worry about it happening. It then uses this to adjust (or ‘weight’) the education attainment index. After the Education and Inspections Act 2006, ONS increased the ‘weight’ of the bullying index, making it a more important measure of the quality of education, because the legislation was a sign of the government’s intention to take action against bullying.
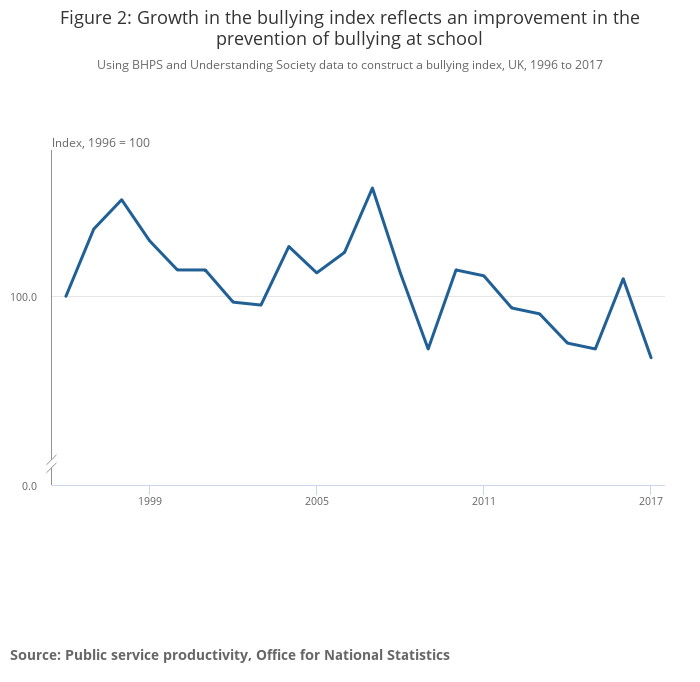
The graph shows the bullying index getting worse over time, meaning that any decrease in the prevalence of bullying has been offset by an increasing impact of bullying on life satisfaction. ONS suggests that, because there have been more regulations in schools to tackle bullying since 2006, the perception of bullying might have increased.
ONS says, “The government has given a lot of attention to this issue, since there is an awareness that bullying, especially if left unaddressed, can have a devastating effect on individuals. Bullying which takes place at school does not only affect an individual during childhood but can have a lasting effect on their lives well into adulthood.”
Read more about the bullying index
This research used Understanding Society data Waves 1-7, and British Household Panel Survey data Waves 1-18
Education