Understanding Society’s Insights report this year is about housing, and they asked me to add to the dialogue around it by giving an overview of some of what we currently know about housing behaviour.
To begin with: why is this important? Why are ‘residential dynamics’ interesting? Because they matter for all of us throughout our lives. Health, work, education, and family all intersect with housing. It’s not too grand to say that housing behaviour is an engine of change in society.
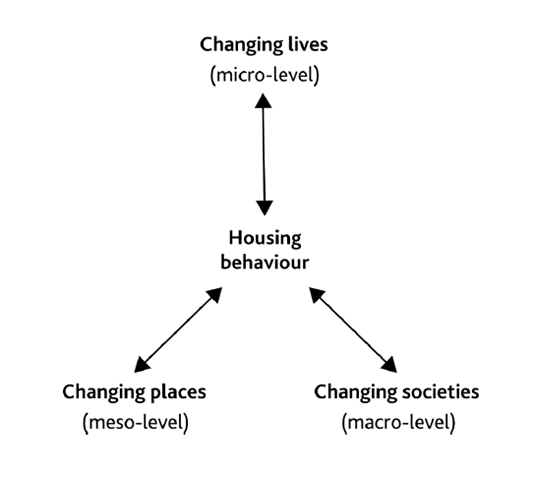
Our housing behaviour affects our lives, obviously – the shape and size of our homes affect our daily routines, and vice versa. And who stays, or moves, and where, when and why, are all crucial for place dynamics. And each area that changes contributes to change at the societal level.
Perhaps most importantly, land, and who owns it, is predominantly what governs wealth – how it’s produced, and how it’s transferred from one person (or generation) to another. Hence my interest – what could be more relevant for a geographer than land?
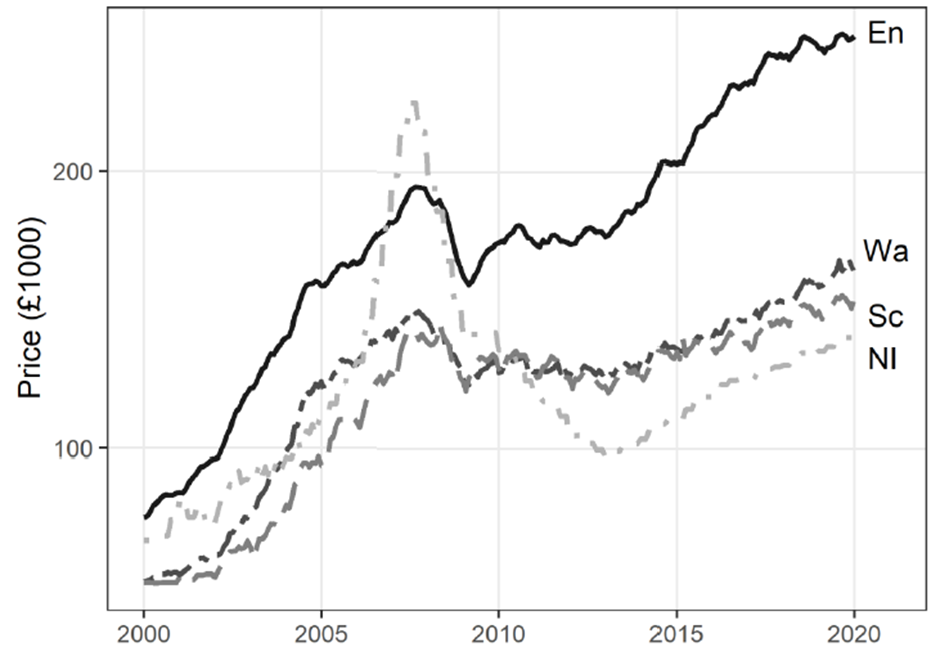
Rising prices to crisis
Firstly: some context. Housing is now part of mainstream policy debates in a way it wasn’t for decades. We saw that in manifesto commitments to house-building from all three main parties at last year’s general election. The key issue, of course, is affordability.
Unaffordable housing is a constraint on people’s lives, choking off ‘good’ things. For example, it damages productivity by making it difficult for people to live near their work, requiring them to make long commutes. It’s bad for social mobility, because people can’t move to find work or education. And it increases inequality, as the gap in property wealth between the most and least affluent grows.
The frustration of not being able to afford housing has knock-on effects such as people delaying forming families, which is causing social change. Above all, perhaps, what we’re seeing is a severing of the intergenerational contract – that sense that we are handing the next generation a better world, with better prospects.
The obvious solution is to boost housing supply, hence those manifesto promises, and only time will tell whether those commitments can be fulfilled. In the meantime, I want to look at two things: residential moves, and housing ‘careers’ (meaning the succession of dwellings and neighbourhoods people live in over their life span). These give us a picture of where we are now, to understand more what our priorities should be.
I’m going to focus mostly on younger adults, because they make around 75% of all moves, so it’s these younger ‘outsiders’ to the housing system who are driving change, rather than older ‘insiders’ who are more established, and better insulated from changes in the housing market.
The decline of mobility?
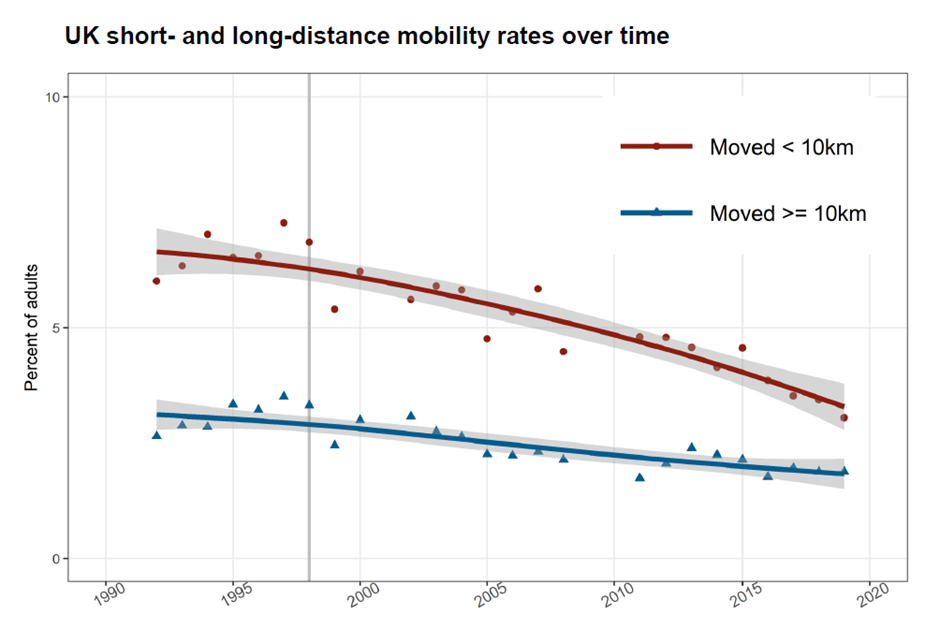
There has been a decline in people moving home in many countries, and it’s been especially well documented in the United States for over 20 years. We don’t fully know why it’s happening, though. It could be partly due to the composition of the population, because an ageing population means job changes become less common. It could also be behaviour-related – with people feeling they have less to gain from moving, or feeling less need to – or it could be some combination of these factors. What we do know is that housing matters and that there have been steep declines in mobility for younger people and renters.
The picture in the UK is less clear, but census and administrative data show some slowdown of shorter moves. There has been little analysis of survey data on this, but Understanding Society (and British Household Panel Survey) data do indeed show a fall in shorter moves. These shorter distance moves are typically down to a desire to move to a different home (for example to one which is larger), rather than related to changing job.
If we look at changes in mobility rates since the 1990s by age group, using data from the Labour Force Survey, there’s clear evidence of stability over the age of 30, and falling rates in younger adulthood.
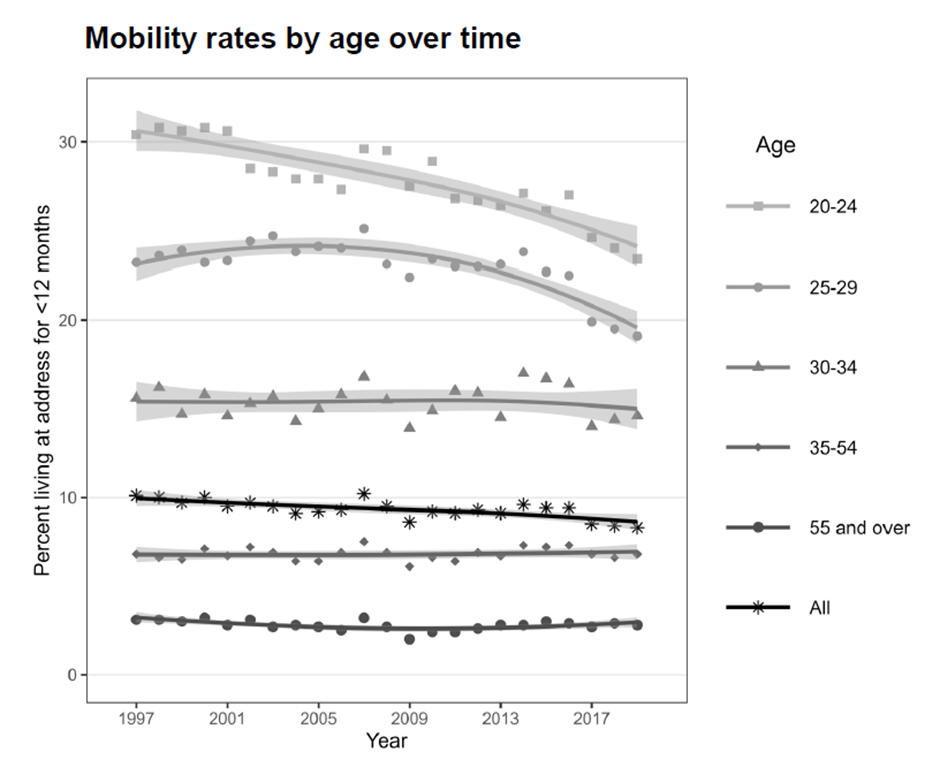
What this suggests is that something distinctive is happening in young adulthood: either young people no longer need to move as often as they once did, or perhaps moving has become more difficult for them. And what this chart doesn’t show is that this trend is mostly happening in rental accommodation – there’s a modest drop in owner moves but a really big drop for tenants, even though the growth of rental housing is thought to make for more flexible lives.
If we look at where young people are living, we see a big decrease in owner-occupiers aged 20-34 between 1997 and 2019, and a small decrease in this age group in social rented accommodation. This is matched by a near doubling of the percentage in privately rented homes, and a big jump in those living with their parents.
These findings aren’t a surprise, but what is more surprising is that mobility among young owner-occupiers is quite stable, even though there’s been a large fall in the percentage of people owning their own home. Also, there has been a massive fall in mobility rates in the private rental sector. Given the growth in younger educated people and migrants, this is unexpected, so it seems the increase in the percentage of this age group living with their parents is driving up residential stability in young adults.
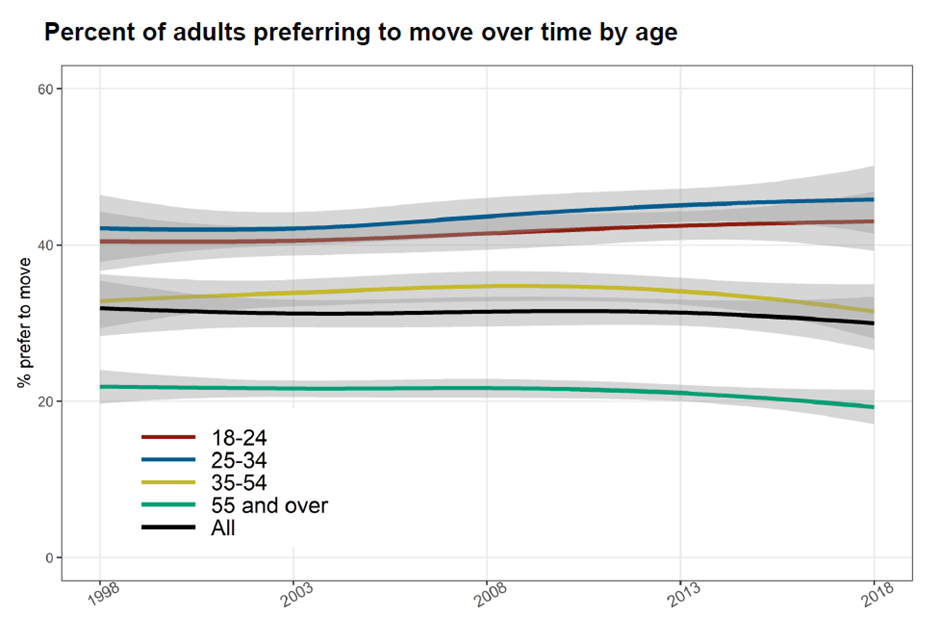
What we’re seeing overall then is housing careers that are ‘stickier’ and less flexible. The question is whether this shift is a choice, or a sign that people are constrained from doing what they want. If we look at the figures for people wanting to move over roughly the same period, we can see that the appetite for moving remains relatively constant. This suggests that strengthening constraints – not being able to act on a desire to move – is at least part of the reason why younger people are relocating less often.
Housing careers
One of the exciting things about a panel survey like Understanding Society is that we can track how people’s lives change as they get older. If we do this for two groups of young people – those aged between 18 and 24 in 1999, and those aged 18-24 in 2009-10 – and compare the housing that both groups lived in over the next ten years of their lives, we can see stark trends: falling rates of entry to homeownership, and later homeownership. What we don’t see is a huge increase in the percentage who ever rent privately – it’s more that people rent privately for longer.
This age group also shows increasing reliance on the parental home, staying there for longer, too. The Institute for Fiscal Studies has done some work on this recently, showing that the proportion of UK adults in their 20s and 30s co-residing with their parents has risen by over a third over the last two decades.
We can also compare four recent and tightly defined seven-year birth cohorts: those born 1967-73, 1974-80, 1981-87, and 1988-94. In the first two cohorts, we see high rates of entering homeownership, with the curve slowing as people get to their late 20s and 30s. In the later cohorts (the lower lines) we see lower, slower and later homeownership over time. This has not just happened over a generational timescale, but rapidly and in a non-linear fashion through the last few decades. The younger cohorts have partly caught up with their predecessors as they aged beyond 30, though, which suggests affordability issues leading to later home purchases is an important factor.
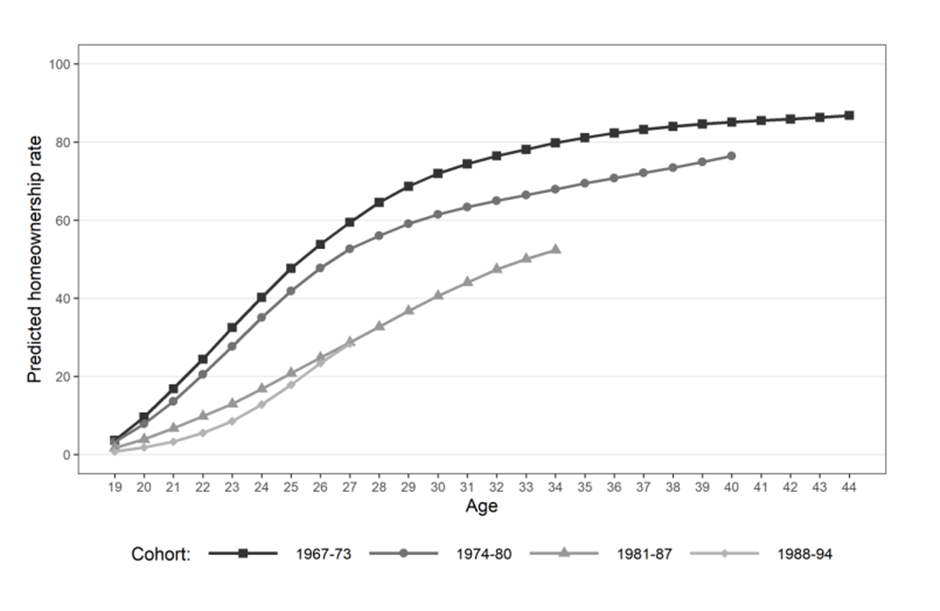
These broad patterns are shaped by many factors, not least changing life courses and the economic position younger adults are in. Even when we take factors such as reduced incomes, and debts from higher education, into account, though, we still find a strong cohort decline that can’t be explained away. This again suggests – perhaps not surprisingly – that a lack of available/affordable housing is a significant problem.
Family help
There are two important ways in which people can smooth their path to being homeowners: leave London, where property is particularly expensive, and/or stay in their parents’ home and save up. The London ‘penalty’ for would-be homeowners increased during the 1990s and 2000s in particular.
On the subject of parents, of course, the other well-known advantage they can offer – if (and it is a big if) they’re in a position to – is to help their children buy property. This is typically through inheritance, gifts or help getting a mortgage – and, of course, middle-class parents are more likely to own, and to be able to offer this support, than those from less advantaged socioeconomic groups.
What we’re seeing in terms of the effects of parental help are:
- younger owners – getting help from one’s parents can reduce the age at which someone becomes a property owner by several years
- reduced debt – those getting help enjoy a lower ratio of loan-to-value (the price of their home compared to the size of their mortgage), and are less likely to borrow heavily.
‘Stickiness’ and inequality
Overall, the 21st century has been a period of change in housing behaviours – particularly for younger age groups entering the system. We’ve been moving towards a ‘stickier’ system, which is more influenced by people’s family backgrounds. Relying on parental support – by staying at home, or getting help with buying, and sometimes both – has become more common. This is bad for social mobility and inequality. Housing is at the heart of this, and the effects are not just economic. Where and how we live is linked in with so many other aspects of our lives that we can also see effects on health inequality, too.
Understanding Society’s Insights report on the housing crisis is out on Wednesday
Rory Coulter’s Housing and Life Course Dynamics – Changing Lives, Places and Inequalities is available from Policy Press
Authors

Rory Coulter
Rory Coulter is Associate Professor in Human Geography at University College London


