
There were riots in June this year in Northern Ireland after two Romanian teenagers were arrested on suspicion of attempted rape. What the police described as “racist thuggery, pure and simple” saw 15 officers injured, six homes attacked, some set on fire, and several businesses having their doors and windows smashed.
First Minister Michelle O’Neill also referred to “pure racism”, and SDLP leader Claire Hanna called the events a “pogrom”. Another politician, though, Jim Allister, leader (and founder) of Traditional Unionist Voice, said the violence “distracts from the very real grievances” about “rapid demographic change” in the area.
The issue of immigration, it seems, is not likely to lose its power to elicit strong emotions any time soon. If we take a step, back, though, what do the data tell us? Is growing social diversity really a threat to social cohesion?
Immigration figures
Figures from the Office for National Statistics, although they show immigration falling in 2024, tell us that “the number of people migrating to the UK has been greater than the number emigrating in each year since 1994”.
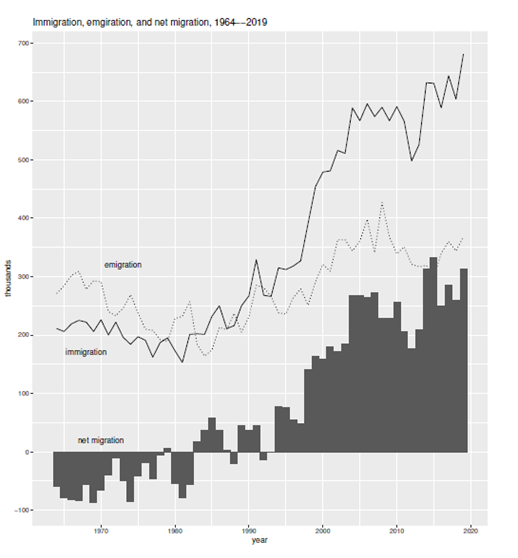
Net migration for the whole of the UK in 2024 was 431,000 people. The Northern Ireland Assembly’s figures show net international migration of 62,000 – but not in one year. That’s for the 22 years from 2001 to 2023, with 4,900 of them in that time going to Ballymena, where the rioting took place. The largest numbers have come from Poland, the Republic of Ireland, and Romania, and only about 3.5% of the NI population is from an ethnic minority – compared to 18% in England and Wales and around 13% in Scotland. On the face of it, social tension does not necessarily follow from strong migrant flows or high level of social diversity.
Having said that, the White population of the UK has fallen, according to the Census – from 91% in 2001 to 86% in 2011, and 82% in 2021. All other ethnic groups grew. So, while Whites are still clearly in the majority, we are becoming a more diverse society. What (if anything) might that be costing us?
Social democracy
Former government minister Lord Willetts has said “You can have a Swedish welfare state provided that you are a homogeneous society with intensely shared values … Progressives want diversity but they thereby undermine part of the moral consensus on which a large welfare state rests.”
Historian Tony Judt echoed this, writing: “where immigration and visible minorities have altered the demography of a country, we typically find increased suspicion of others and a loss of enthusiasm for the institutions of the welfare state”.
Political scientist Robert Putnam has said that “in ethnically diverse neighbourhoods residents of all races tend to ‘hunker down’. Trust (even of one’s own race) is lower, altruism and community cooperation rarer, friends fewer”.
This ‘constrict’ theory has been popular with pundits. Roger Eatwell and Matthew Goodwin’s book National Populism: The Revolt Against Liberal Democracy predicts that “Citizens will, at least in the short term, become less trusting of others, less willing to co-operate”. Eric Kaufman’s White Shift says “more diversity equals less solidarity”. David Goodhart went with: “sharing and solidarity can conflict with diversity”.
What does existing research tell us?
This issue has been tested empirically, but the results so far have been mixed. One review of 90 papers on the link between ethnic diversity and social cohesion found that 26 supported the constrict theory, 25 contradicted it, and 39 had mixed results. Another, looking at 87 papers, says “few clear answers have been reached” and that while “on average, social trust is lower in more ethnically diverse contexts”, especially very small local neighbourhoods, the effect size is modest.
Some of the problems with this question are connected to the different measures we can use. For example, researchers investigating social diversity often employ the fractionalisation index. Unfortunately, this is ‘colour-blind’, in the sense that a neighbourhood which is 80% White and 20% Black will have the same fractionalisation score as one that is 20% White and 80% Black. But clearly these will be very different neighbourhoods.
Also, research in the US has found that because native-born White people, “who are disproportionally represented in homogeneous communities … score higher on prosocial indicators”, when the analysis takes this into account, “negative associations with ethnic diversity are strongly reduced and even disappear”. Another paper points out that support for the constrict theory is “less clear cut” if we use ‘community participation’ (a behavioural measure) than if we choose ‘neighbourhood norms’ (a measure of attitudes). Social cohesion is a multi-dimensional concept, so it makes sense to use a range of different measures to examine it.
Apart from anything else, what do we mean by ‘neighbourhood’? We might use any measure from whole regions down to Lower Layer Super Output Areas, and each one will tell us something different. Research using data on social trust from the Danish part of the European Social Survey found that “ethnic diversity in the micro-context [within a radius of 80 to 180 metres] affects trust negatively, whereas the effect vanishes in larger contextual units”. But is an area as small as that really a neighbourhood?
Research using Understanding Society
Juta Kawalerowicz and I have used Understanding Society for two studies which look at this question in detail. Firstly, we used Waves 1, 2, and 3 and treated them as cross-sectional samples of the population.
Understanding Society was useful for this, because it has six variables measuring social cohesion:
- a set of questions about local friendships, and a sense of belonging
- another set of questions about how close-knit the neighbourhood is
- generalised trust
- volunteering
- giving to charity
- inter-ethnic friendship.
We also used four measures of social diversity:
- ethnic fractionalisation
- religious fractionalisation (with eight groups: Christian, Buddhist, Hindu, Jewish, Muslim, Sikh, no faith, and other/not stated)
- the percentage of Muslims in an area
- the percentage of people in the area who were foreign-born.
We defined local neighbourhoods in two ways, as Middle Layer Super Output Areas (MSOAs) and as Local Authority Districts (LADs). In 2011, there were 8,480 MSOAs in Britain, with populations between 5,000 and 15,000 people. There were 378 LADs (on average about 20 times bigger than MSOAs).
We took into account factors including sex, age, marital status, employment, and social class – but also local deprivation, measured by the percentages of:
- unemployed people in an area
- households not owning a car
- households not owning their home
- household overcrowding.
Diversity or deprivation?
We found that, whichever diversity measures we used or however we defined neighbourhoods, people living in more diverse areas tend to report lower levels of generalised trust, and to hold more negative views about their neighbours and neighbourhood. Also, non‐White people in more diverse neighbourhoods are less likely to report inter‐ethnic friendship.
However, once we take the level of material deprivation into account, these negative associations disappear. We also looked for the diversity-cohesion trade‐off in more segregated communities, but again found very little evidence for it.
There was no link between diversity and volunteering or charitable giving. In fact, when we take deprivation into account, we actually see higher levels of volunteering and charitable giving among people living in more diverse neighbourhoods.
What about inter-ethnic friendship, though? Diversity is linked to a greater probability of this, but opportunity matters. As diversity increases, the opportunity to meet someone of a different ethnicity rises for White people, but falls for non-White people, so we looked at them separately.
If they live in more diverse neighbourhoods, White people are indeed more likely to have at least one close friend who is non‐White, regardless of local deprivation. For non‐White respondents, social diversity is negatively associated with interethnic friendship – but once we take local deprivation into account, those negative associations disappear.
In other words, as far as close friendship is concerned, there is no evidence that members of ethnic minorities are confined within their own community, even if they live in socially diverse neighbourhoods.
Overall, there is no evidence to support the constrict theory in Britain. If diverse neighbourhoods appear less cohesive, it’s because they tend to be more deprived.
Longitudinal analysis
However, cross-sectional analyses can suffer by missing out some variables. We wanted to be more confident of our results by looking at the issue longitudinally. As time passes, and social diversity rises, do communities become less cohesive?
There has been some longitudinal research using the British Household Panel Survey (BHPS, Understanding Society’s predecessor, which ran from 1991 to 2009). This found that changes in community diversity did lead to changes in attitudes towards the community – but it depended whether the people were ‘stayers’ or ‘movers’.
If people stayed in the same area for two or more waves of the survey, and their community grew more diverse around them, there was a decline in how much they liked living in their neighbourhood. If people moved to a less diverse community, the more homogeneous it was, the more likely it was that they would say they liked living there. For people moving to more diverse communities, increasing diversity was not linked to any change in their attitude to their neighbourhood.
The researchers concluded that there was evidence of a causal link between rising diversity and falling cohesion.
Replicating the results
Juta and I carried out a new, forthcoming study to do two things: to replicate the results using BHPS, and then to test what we found using newer data from Understanding Society. We also wanted to use different ways to measure social cohesion.
The earlier BHPS research examined people’s ‘community attachment’ by looking at answers to the question: Overall, do you like living in this neighbourhood? This is a binary measure – it gets a yes/no answer. To examine change in community cohesion, only people who changed their mind about whether they liked the neighbourhood were included in the analysis. If someone was consistently attached (or unattached), they were excluded – and many more people consistently liked their neighbourhood than consistently disliked it.
Over the course of BHPS, in fact, an overwhelming majority of respondents liked their neighbourhood: 90% said so in Wave 1, 93% in Wave 11, and 94% in Wave 18 – exactly at the time when Britain was getting more diverse. So, the results of the earlier paper (which, as far as we know, was the only study to test the progressive dilemma with longitudinal data) were biased – it drops from the analyses a lot of respondents who were consistently happy with their neighbourhood even though the neighbourhood was becoming more diverse.
We used two continuous measures of social cohesion (which we’d used for the cross-sectional analysis I mentioned earlier), and again the different measures of diversity. These are more appropriate ways of examining the question than just one binary variable – and we found opposite results. An increase in diversity was associated with a fall in social cohesion, but only before we took deprivation into account. When we include deprivation, the link between diversity and lack of cohesion disappears.
In the second part of our study, using Understanding Society, we found essentially the same results. Not only that, but they were the same for those who stayed put in their community – and there was no evidence that movers were motivated to go because their previous neighbourhood was too diverse, nor that they moved to less diverse places.
History and politics matter, too
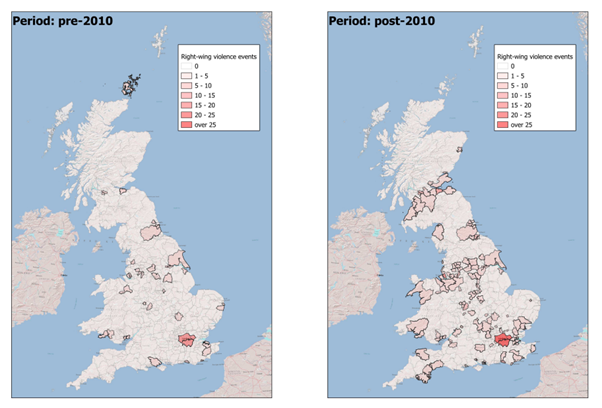
I started by talking about riots, and violence like that (and the events of summer of 2024 in the UK) could have an impact on social cohesion as well. There are data sources we can use to examine this. A list of British National Party members was leaked in 2008, for example, and there is a Far-Right Protest in Europe (FARPE) dataset. We used another: the Right-Wing Terrorism and Violence (RTV) Dataset collected by C-REX (Center for Research on Extremism) at the University of Oslo. Just looking at their raw data for the UK, we can see that far-right attacks in the UK became more common and more widespread after 2010.
In a set of preliminary analysis, we add RTV data to our analysis of Understanding Society, and take into account whether there was at least one event involving right-wing violence in the local authority district since 2010, we find that far-right violence tends to be associated with lower level of social cohesion. Once again, though, when we take material deprivation into account, those associations disappear.
There is still much to explore. Some of the RTV data is not precise enough geographically, and we don’t know from this dataset how intense the violence was, only that it happened. We would also like to take jihadist attacks into account, not just the far right. So we would like to look at other data sources.
Deprivation
Overall, our results show that, for Britain at least, the concern for the ‘progressive dilemma’ is overblown. Every time we have looked at the issue, we have found that it’s material deprivation, not social diversity, that threatens to stretch and tear the social fabric. Perhaps it’s harder to have trust and cooperation when you’re competing for resources. Whatever the cause, the solution seems to lie less in measures to limit immigration than it does in investment to tackle poverty and inequality.
Authors

Professor Tak Wing Chan
Tak Wing Chan is a Professor of Quantitative Social Science at UCL Institute of Education


