Our new data dashboard allows users to build charts that show trends over time and compare different groups. The data in the dashboard comes from the main Understanding Society survey and will be updated when each new wave of the Study is released.
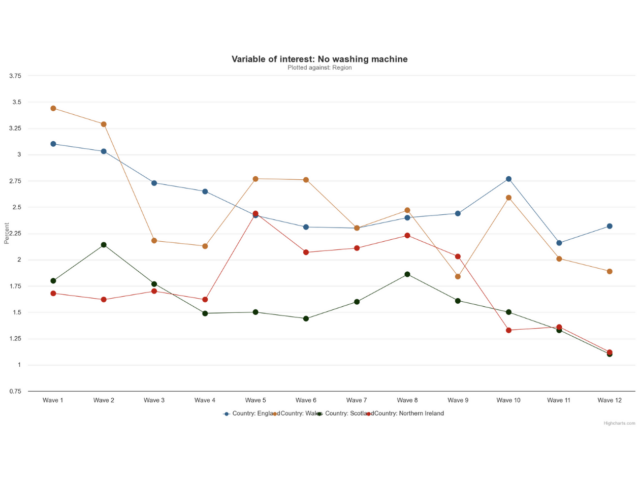
The dashboard includes variables on ownership of various household goods, like televisions and washing machines, and whether the household can afford certain things for their children, like school trips or a warm winter coat. Also included are variables on food bank use and savings. Outputs are based on weighted cross-sectional results and are designed primarily for exploratory analysis.
Try the material deprivation dashboard
Family and householdsIncome and expenditureMoney and finances