
Understanding Society has worked with the UK’s national body for evidence on wellbeing to create a data dashboard on the subject. The new tool brings together data on 15 measures of wellbeing under three headings:
- social capital and connection
- physical and mental health
- life satisfaction.
The aim is to make Understanding Society’s wellbeing data more accessible to non-academic users. They can choose a ‘variable’ – any of the measures that the study collects which give us information about an aspect of wellbeing – and see how it has changed over time.
The measures we collect include:
- loneliness
- psychological distress (using the General Health Questionnaire)
- how happy people are with their relationship.
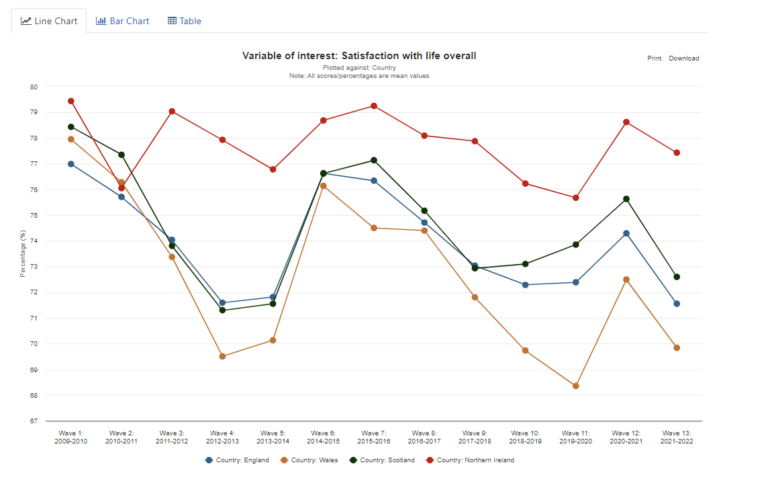
This example from the dashboard shows life satisfaction in the four countries of the UK between Wave 1 (which began in 2009) and Wave 13 (which finished in 2022).
Users can also select up to two socio-demographic characteristics which can affect the results, such as age, sex, ethnicity and marital status. The dashboard then automatically produces a chart showing change over time.
The dashboard was set up in collaboration with the What Works Centre for Wellbeing, which the government established in 2014 as part of its What Works Network to improve the design and delivery of public services.
Margherita Musella, Evidence Associate at What Works Wellbeing, says: “As a broader range of users begins to take advantage of Understanding Society’s rich wellbeing dataset, the survey can continue to contribute to the broader wellbeing evidence base, and support policy directions and priorities to improve and sustain quality of life in the UK.”
Findings and impactInforming PolicyHealth and wellbeing