Let’s look at how UK household spending has changed over time
We’ve taken spending data from across the UK and separated it into different categories, for you to explore and see how it all compares.
We’ve taken spending data from across the UK and separated it into different categories, for you to explore and see how it all compares.
Scroll down or click one of the 5 areas to start
Data gathered by Understanding Society - find out more >
Credits:
Data gathered by Understanding Society - The largest longitudinal study of its kind involving 1000s of households across the UK.
 Mortgage
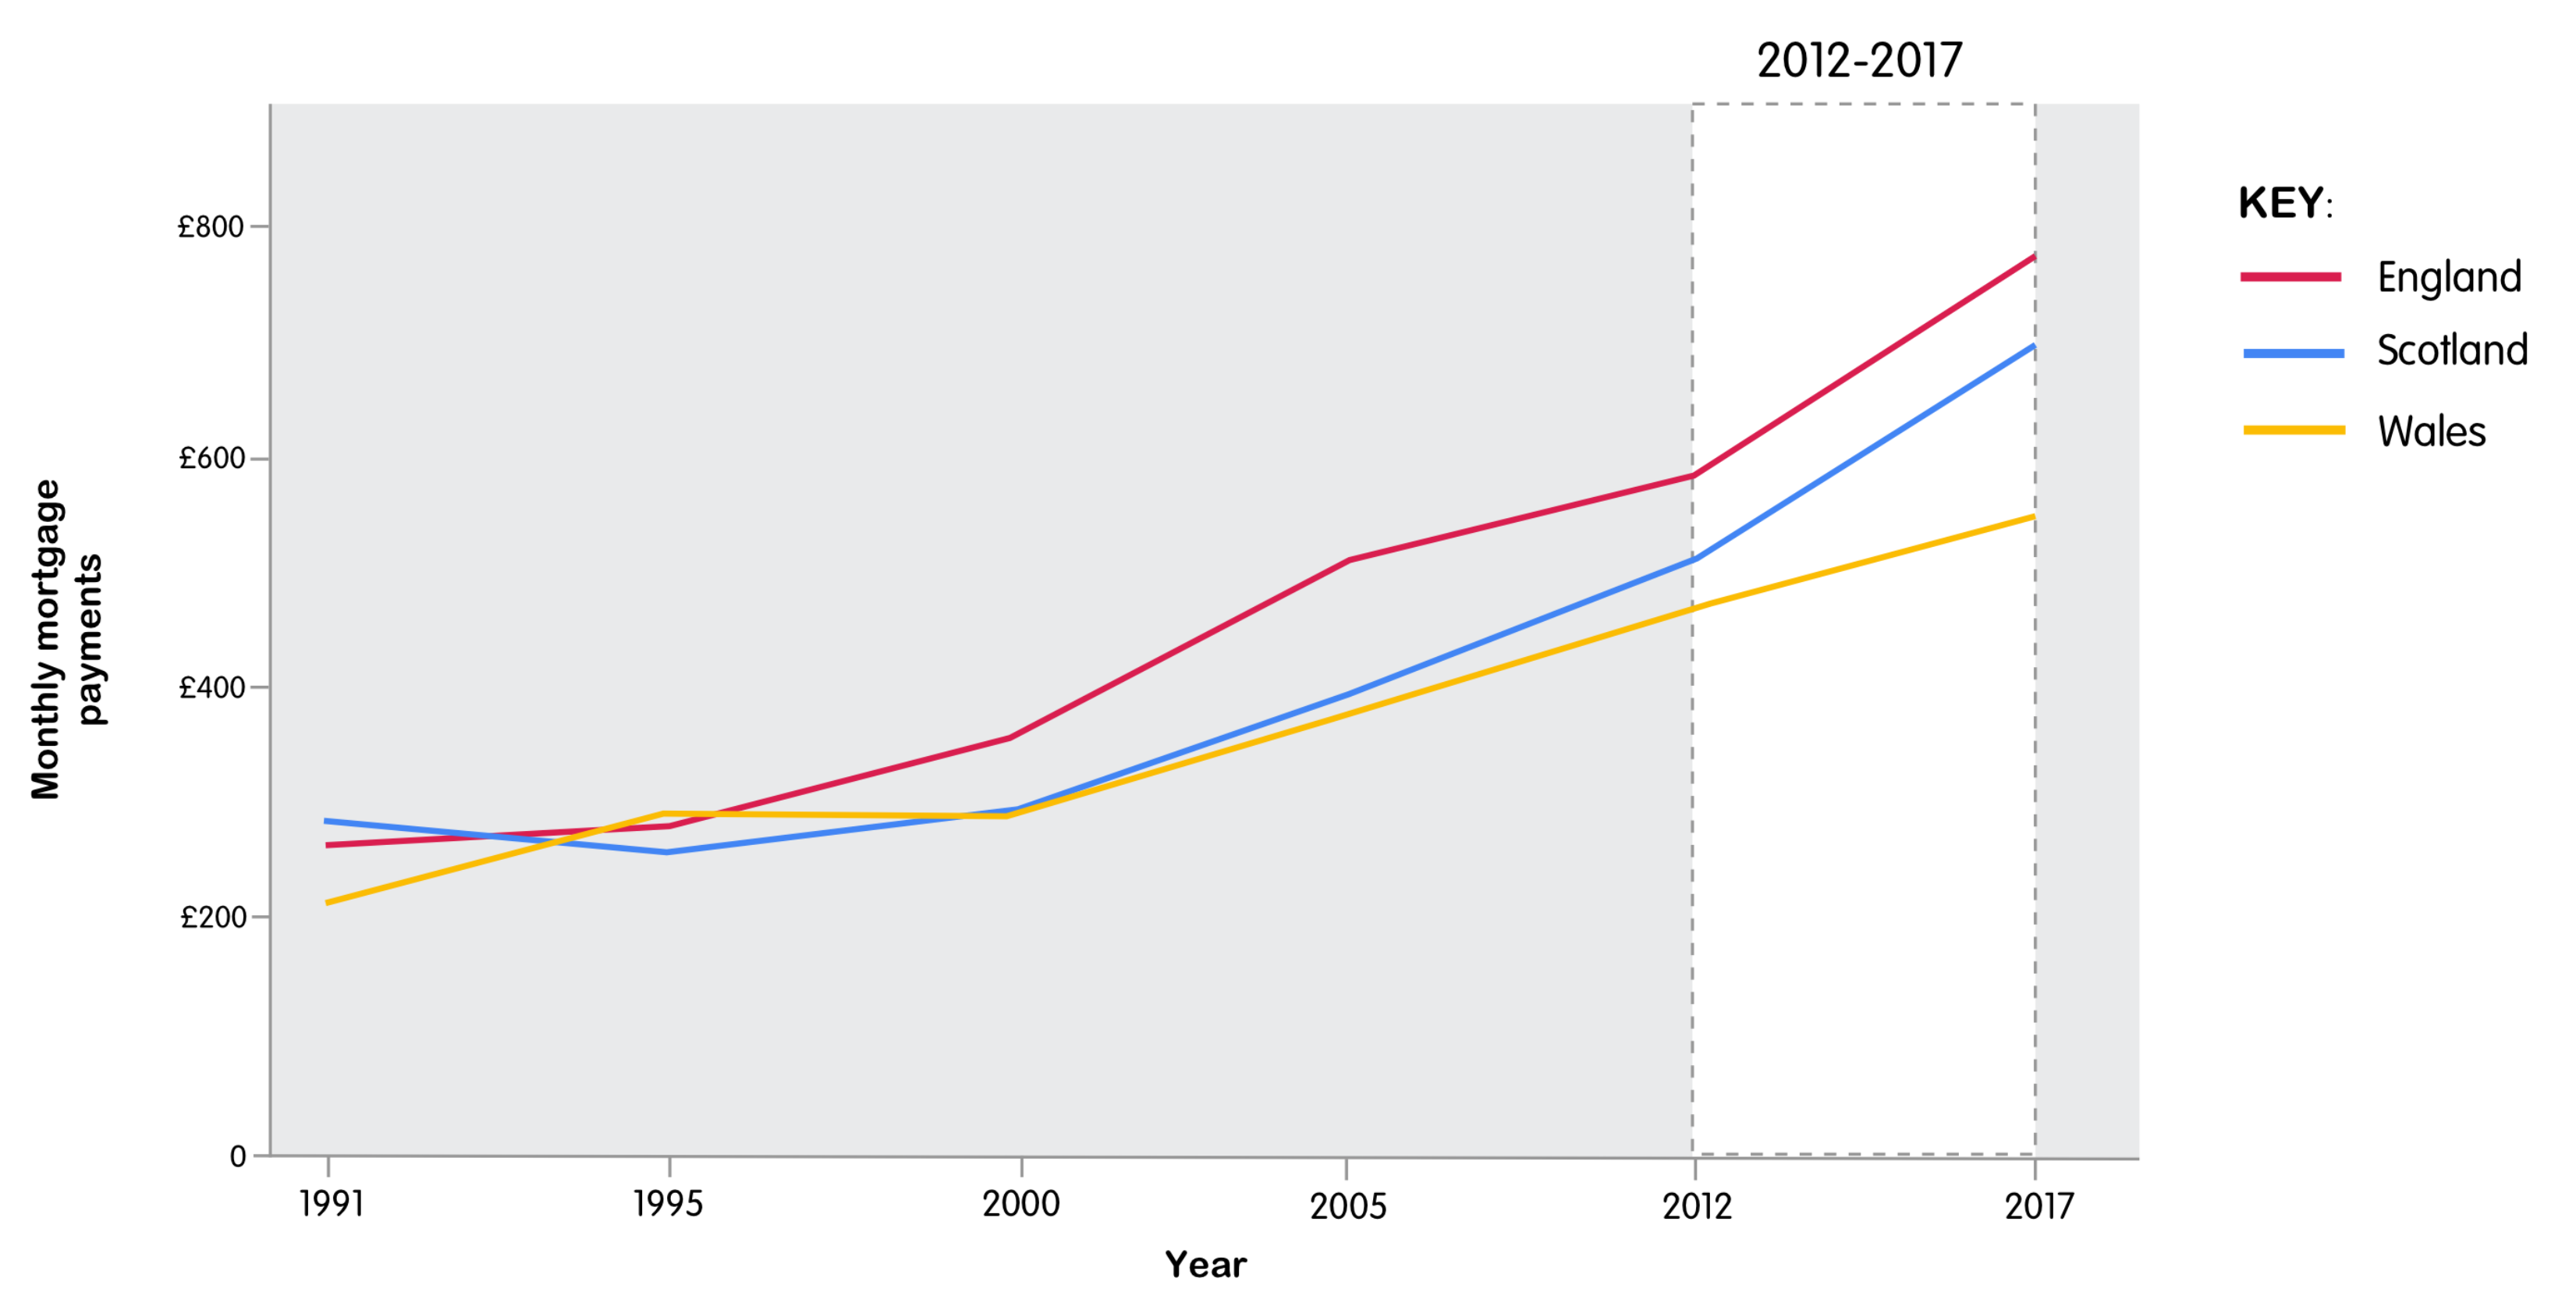
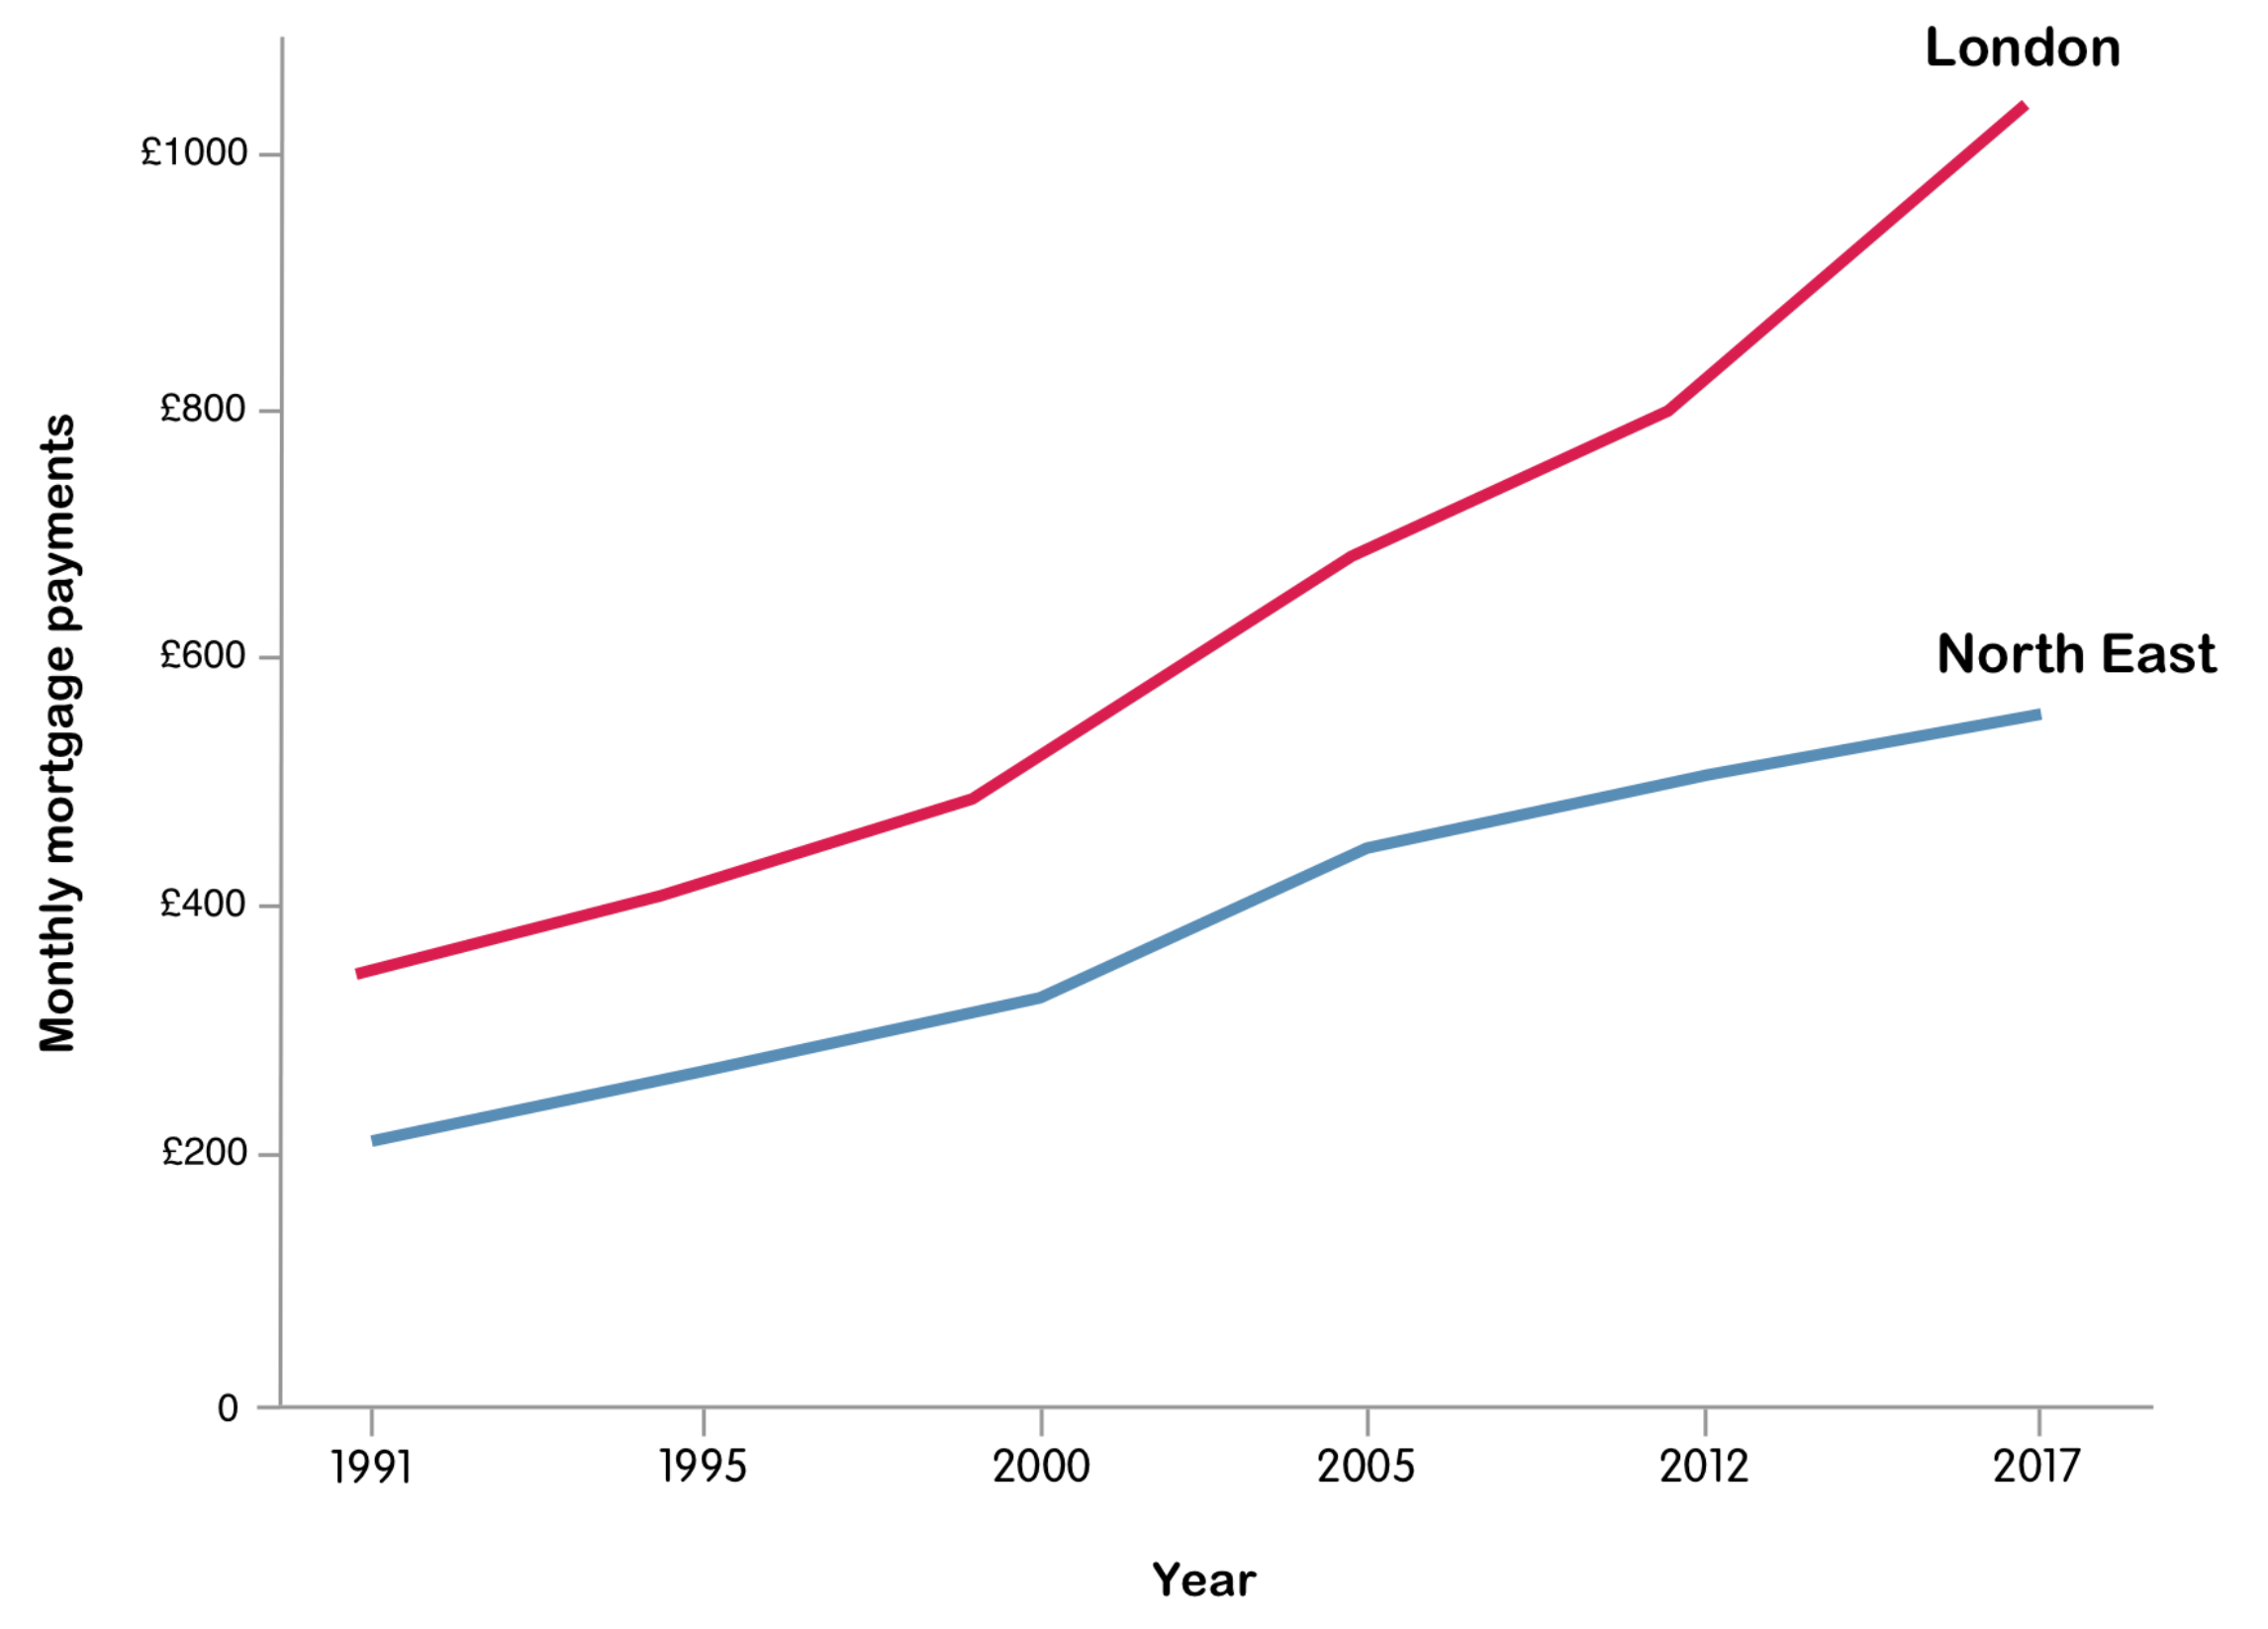
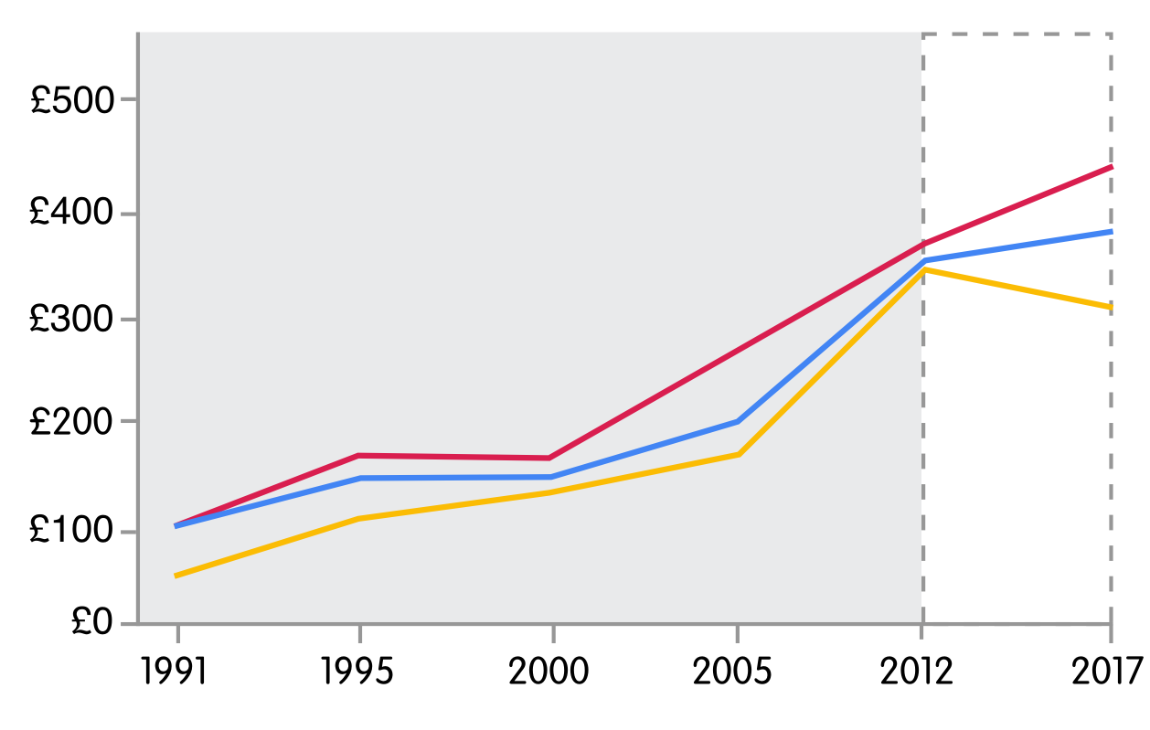
Mortgage payments are on the rise
These UK countries all saw increases in monthly mortgage payments between 1991 and 2017. A sharper increase was seen between 2012 and 2017.
Mortgage payments are on the rise
These UK countries all saw increases in monthly mortgage payments between 1991 and 2017. A sharper increase was seen between 2012 and 2017.
Y axis - Average monthly mortgage payments in £
X axis - By year
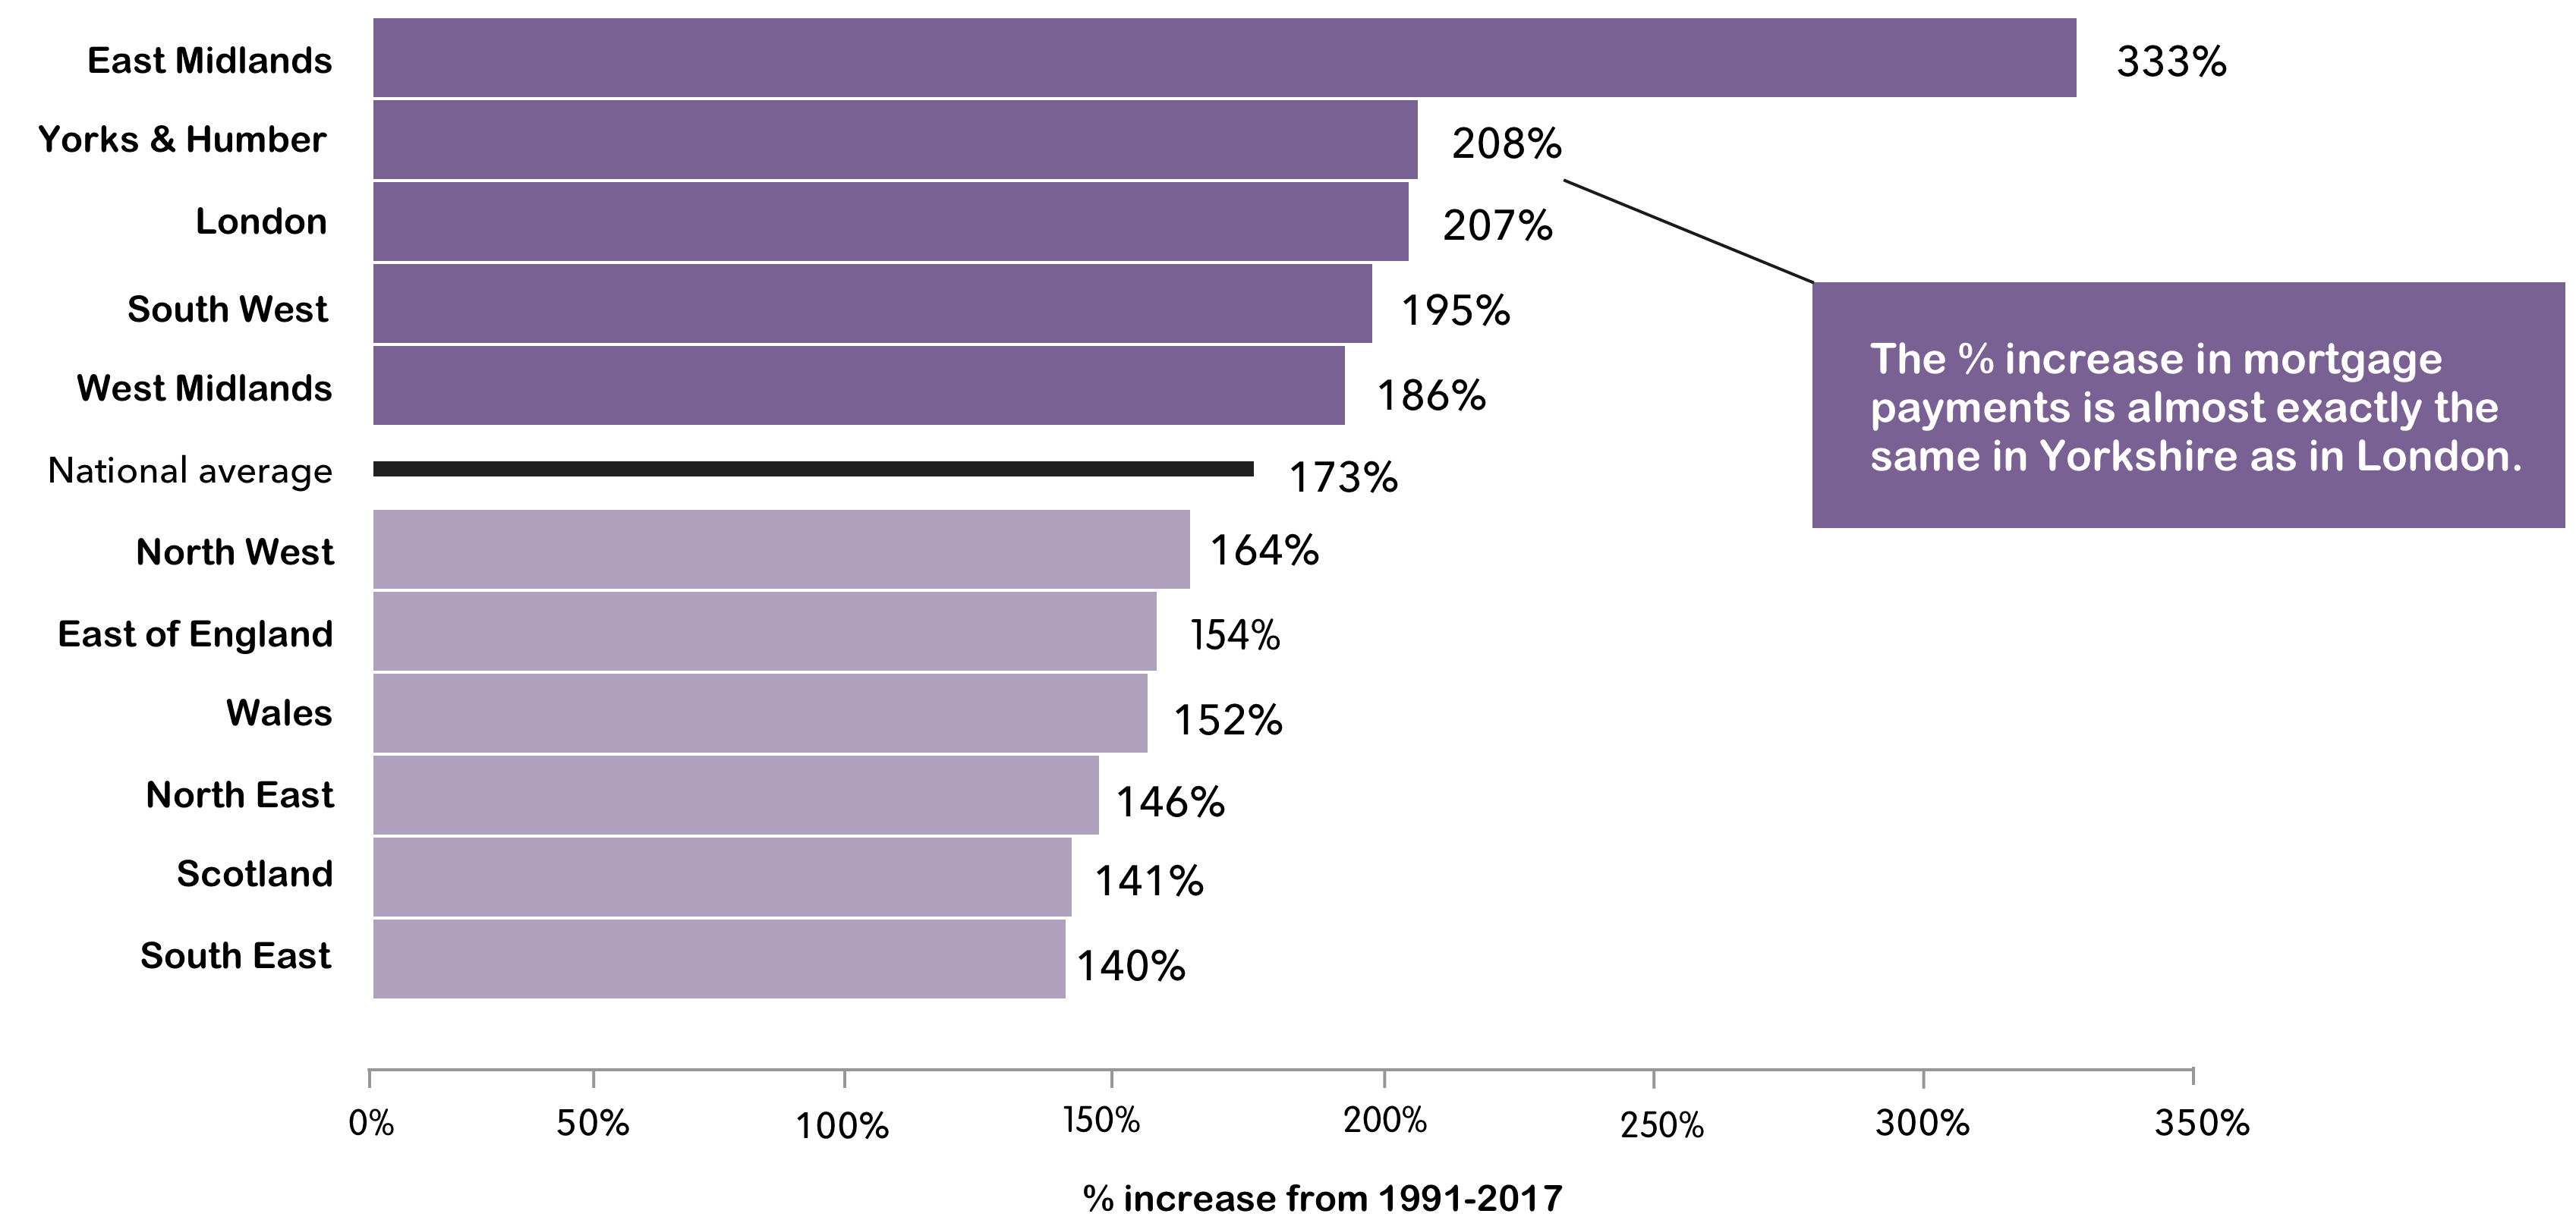
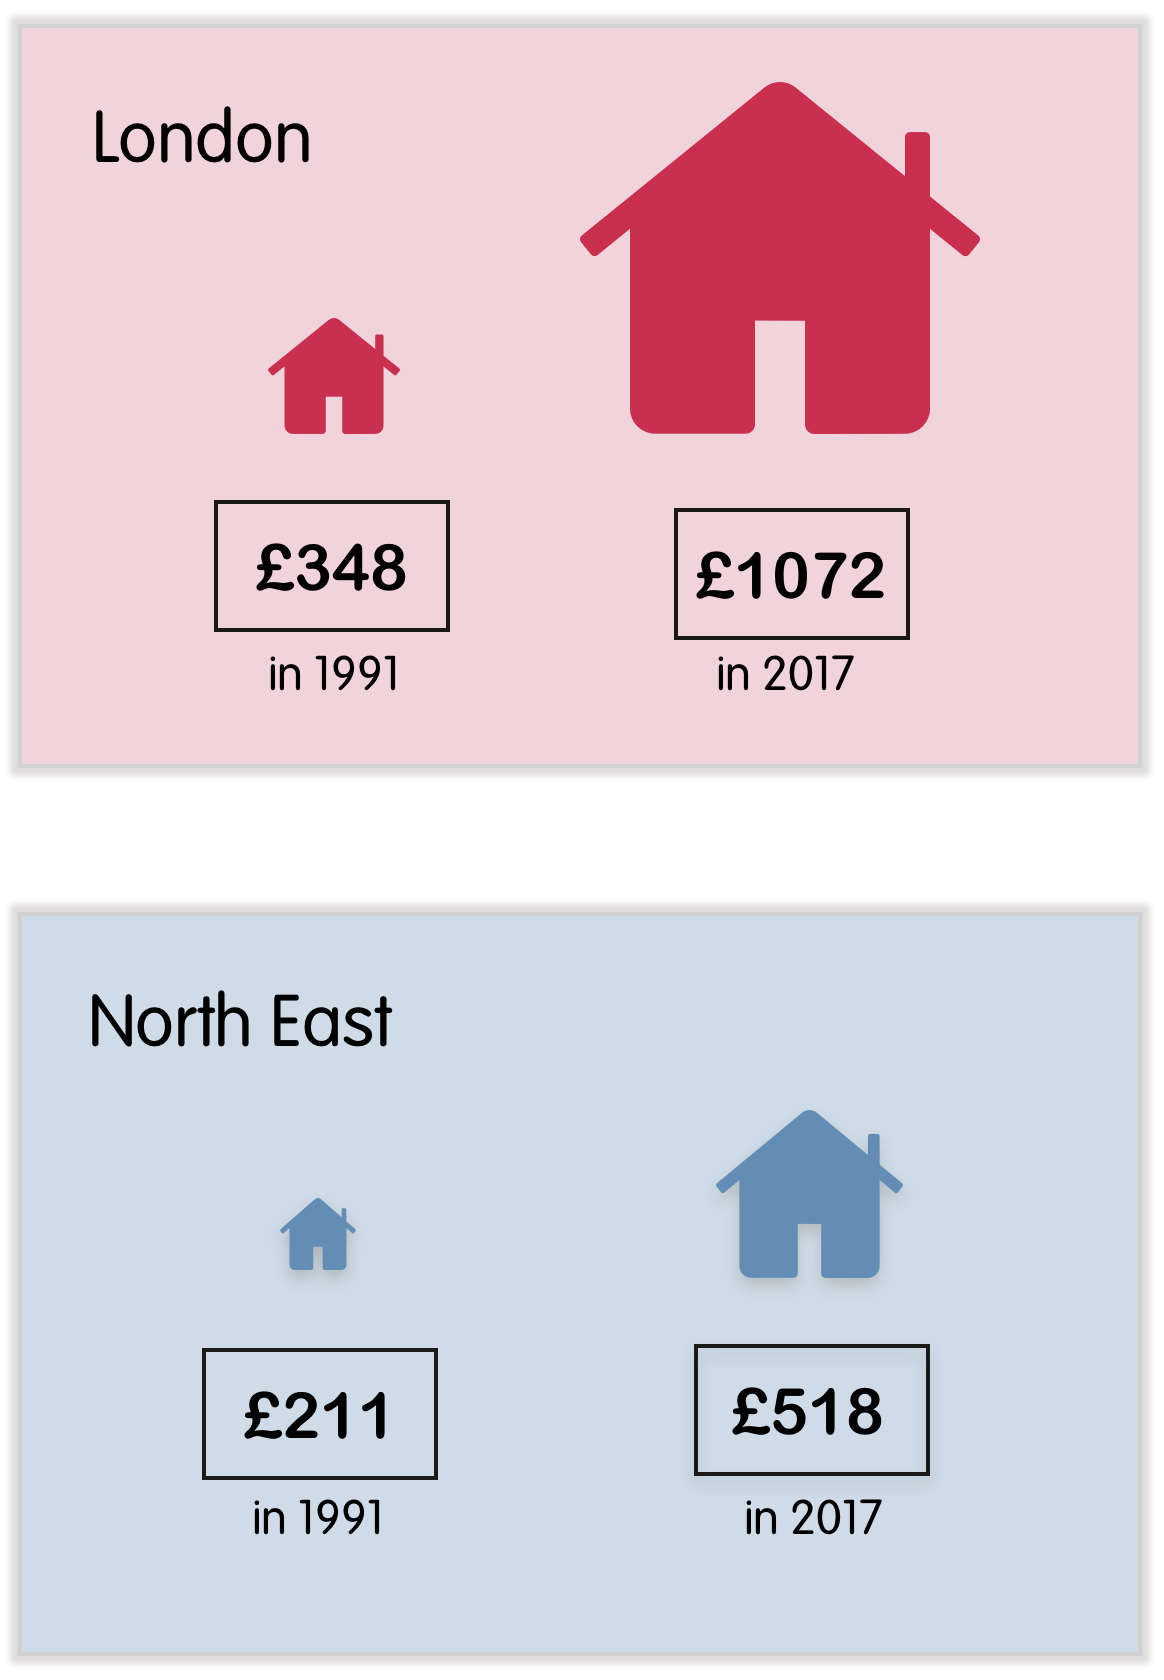
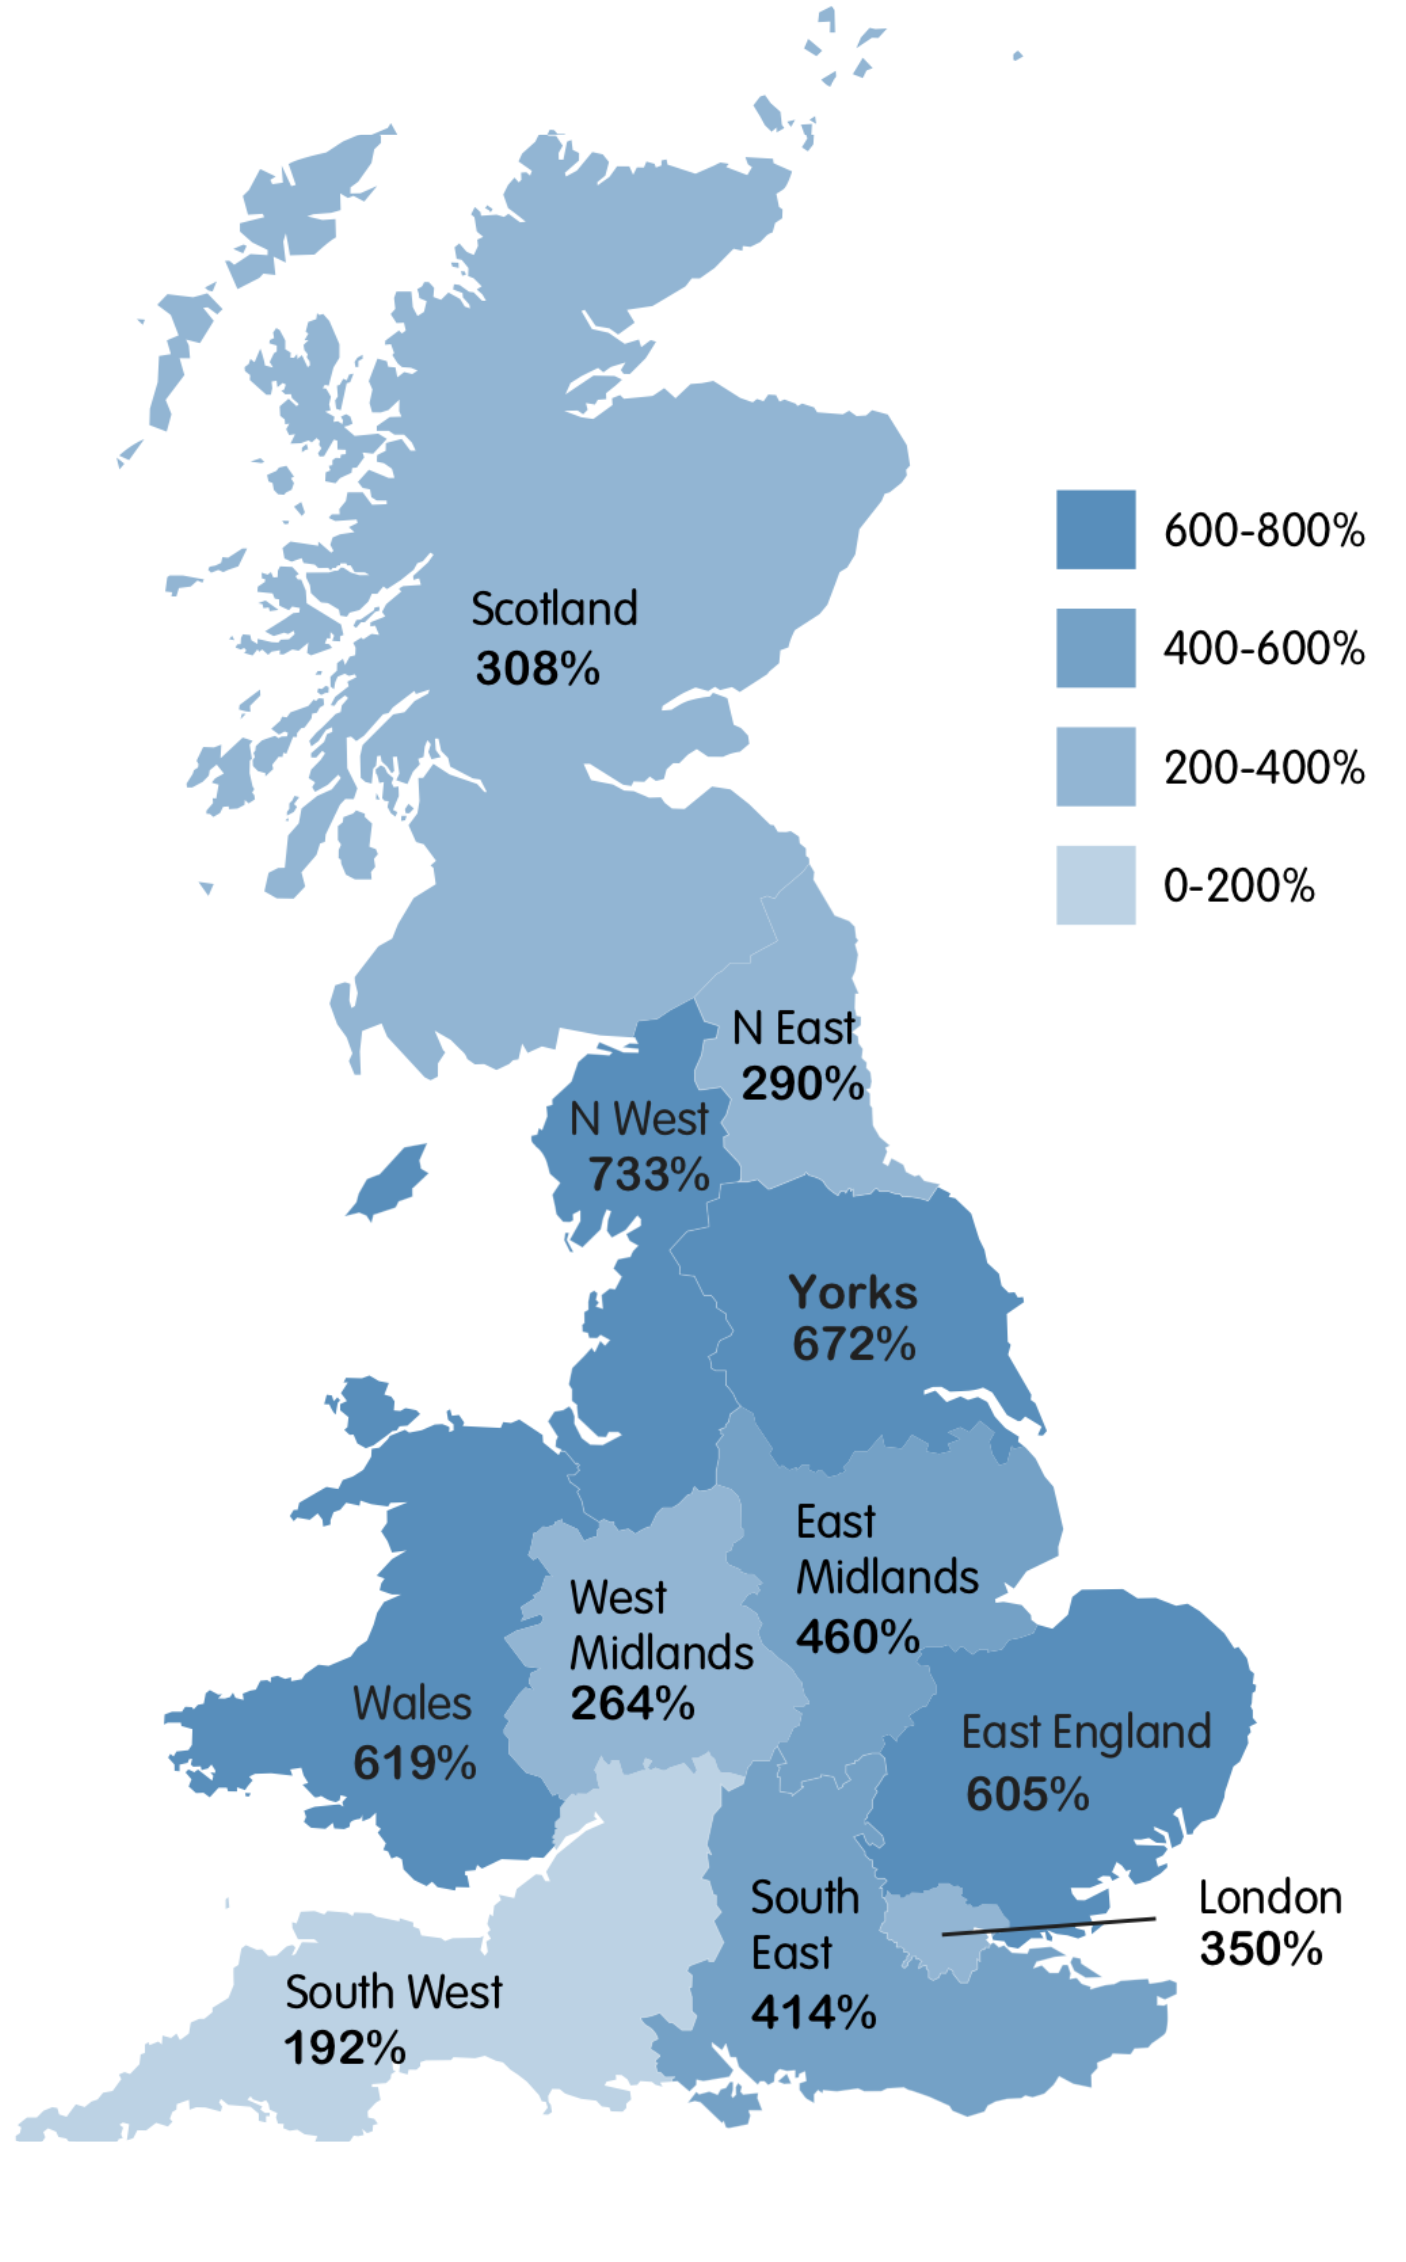
Some areas saw a large increase
Average monthly mortgage payments in the East Midlands rose from £211 to £918 between 1991 and 2017. That's an increase of 933%!

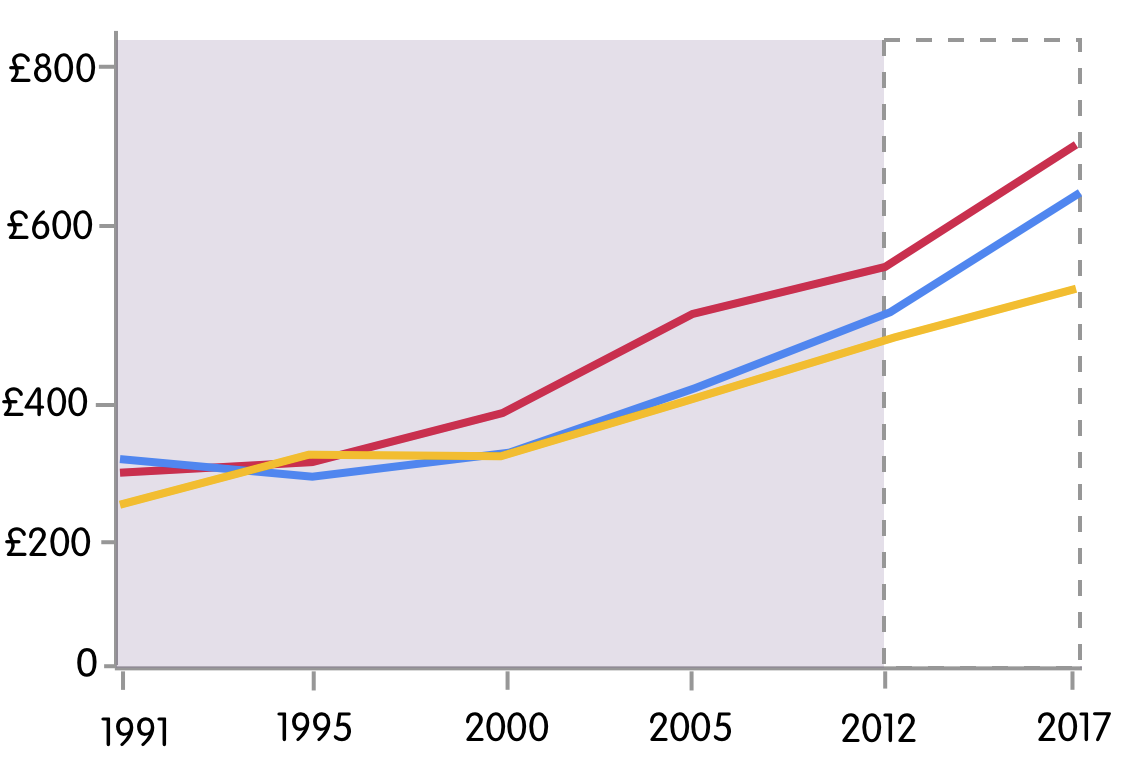
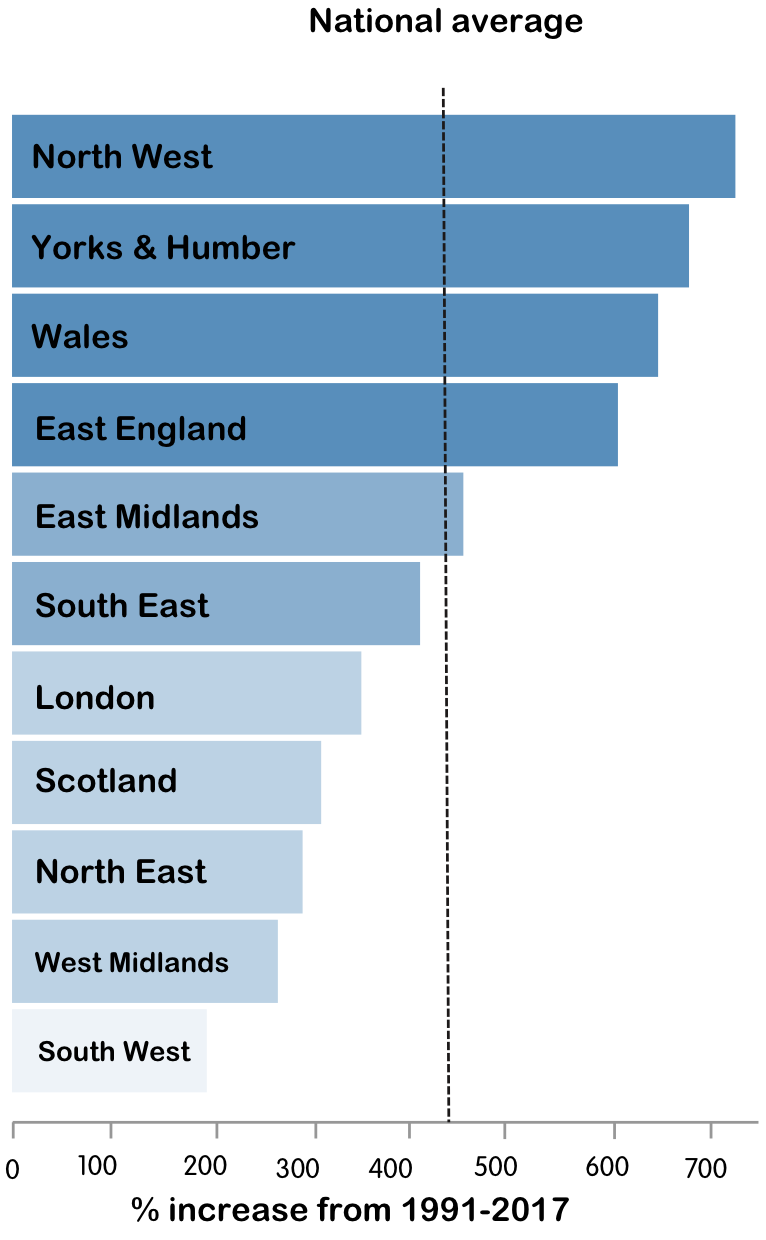
There is growing disparity
The gap between the most expensive and least expensive region for average monthly mortgage payments is widening
There is growing disparity
The gap between the most expensive and least expensive region for average monthly mortgage payments is widening
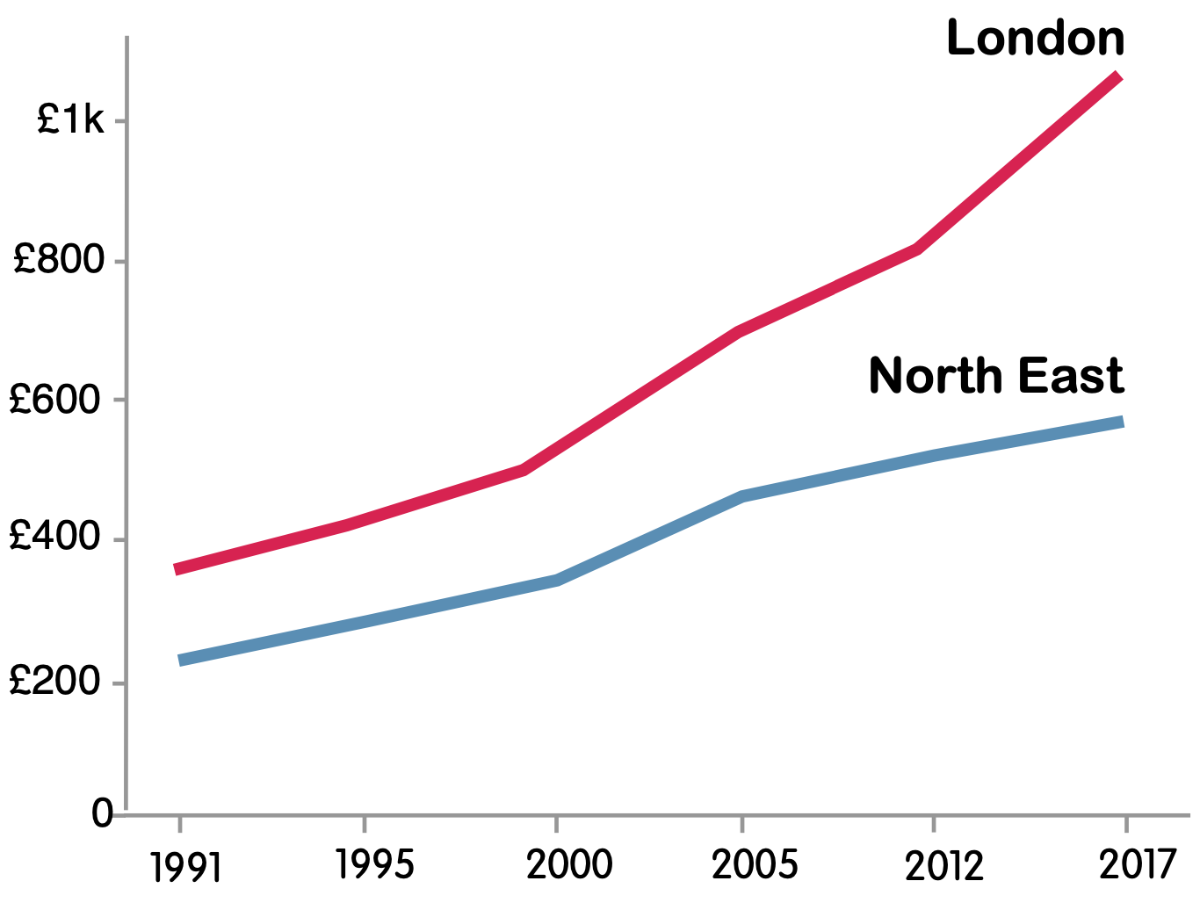
Y axis - Average monthly mortgage payments in £
X axis - By year
 Rent
Rent
Rent has increased at double the rate of mortgages
Over the period from 1991 to 2017
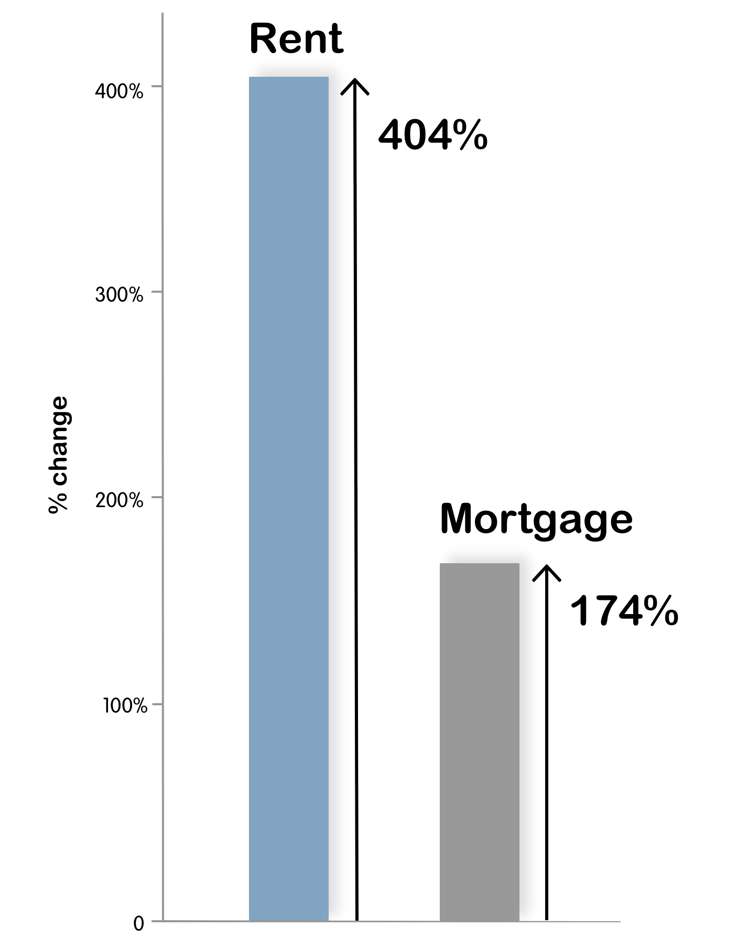
Rent
Mortgage
Rent has increased at double the rate of mortgages
Over the period from 1991 to 2017
Rent
Mortgage
England and Scotland saw recent rent increases
Wales, however saw a decline between 2012 and 2017, after a very sharp rise between 2007 and 2012. It was the only nation that followed this pattern.
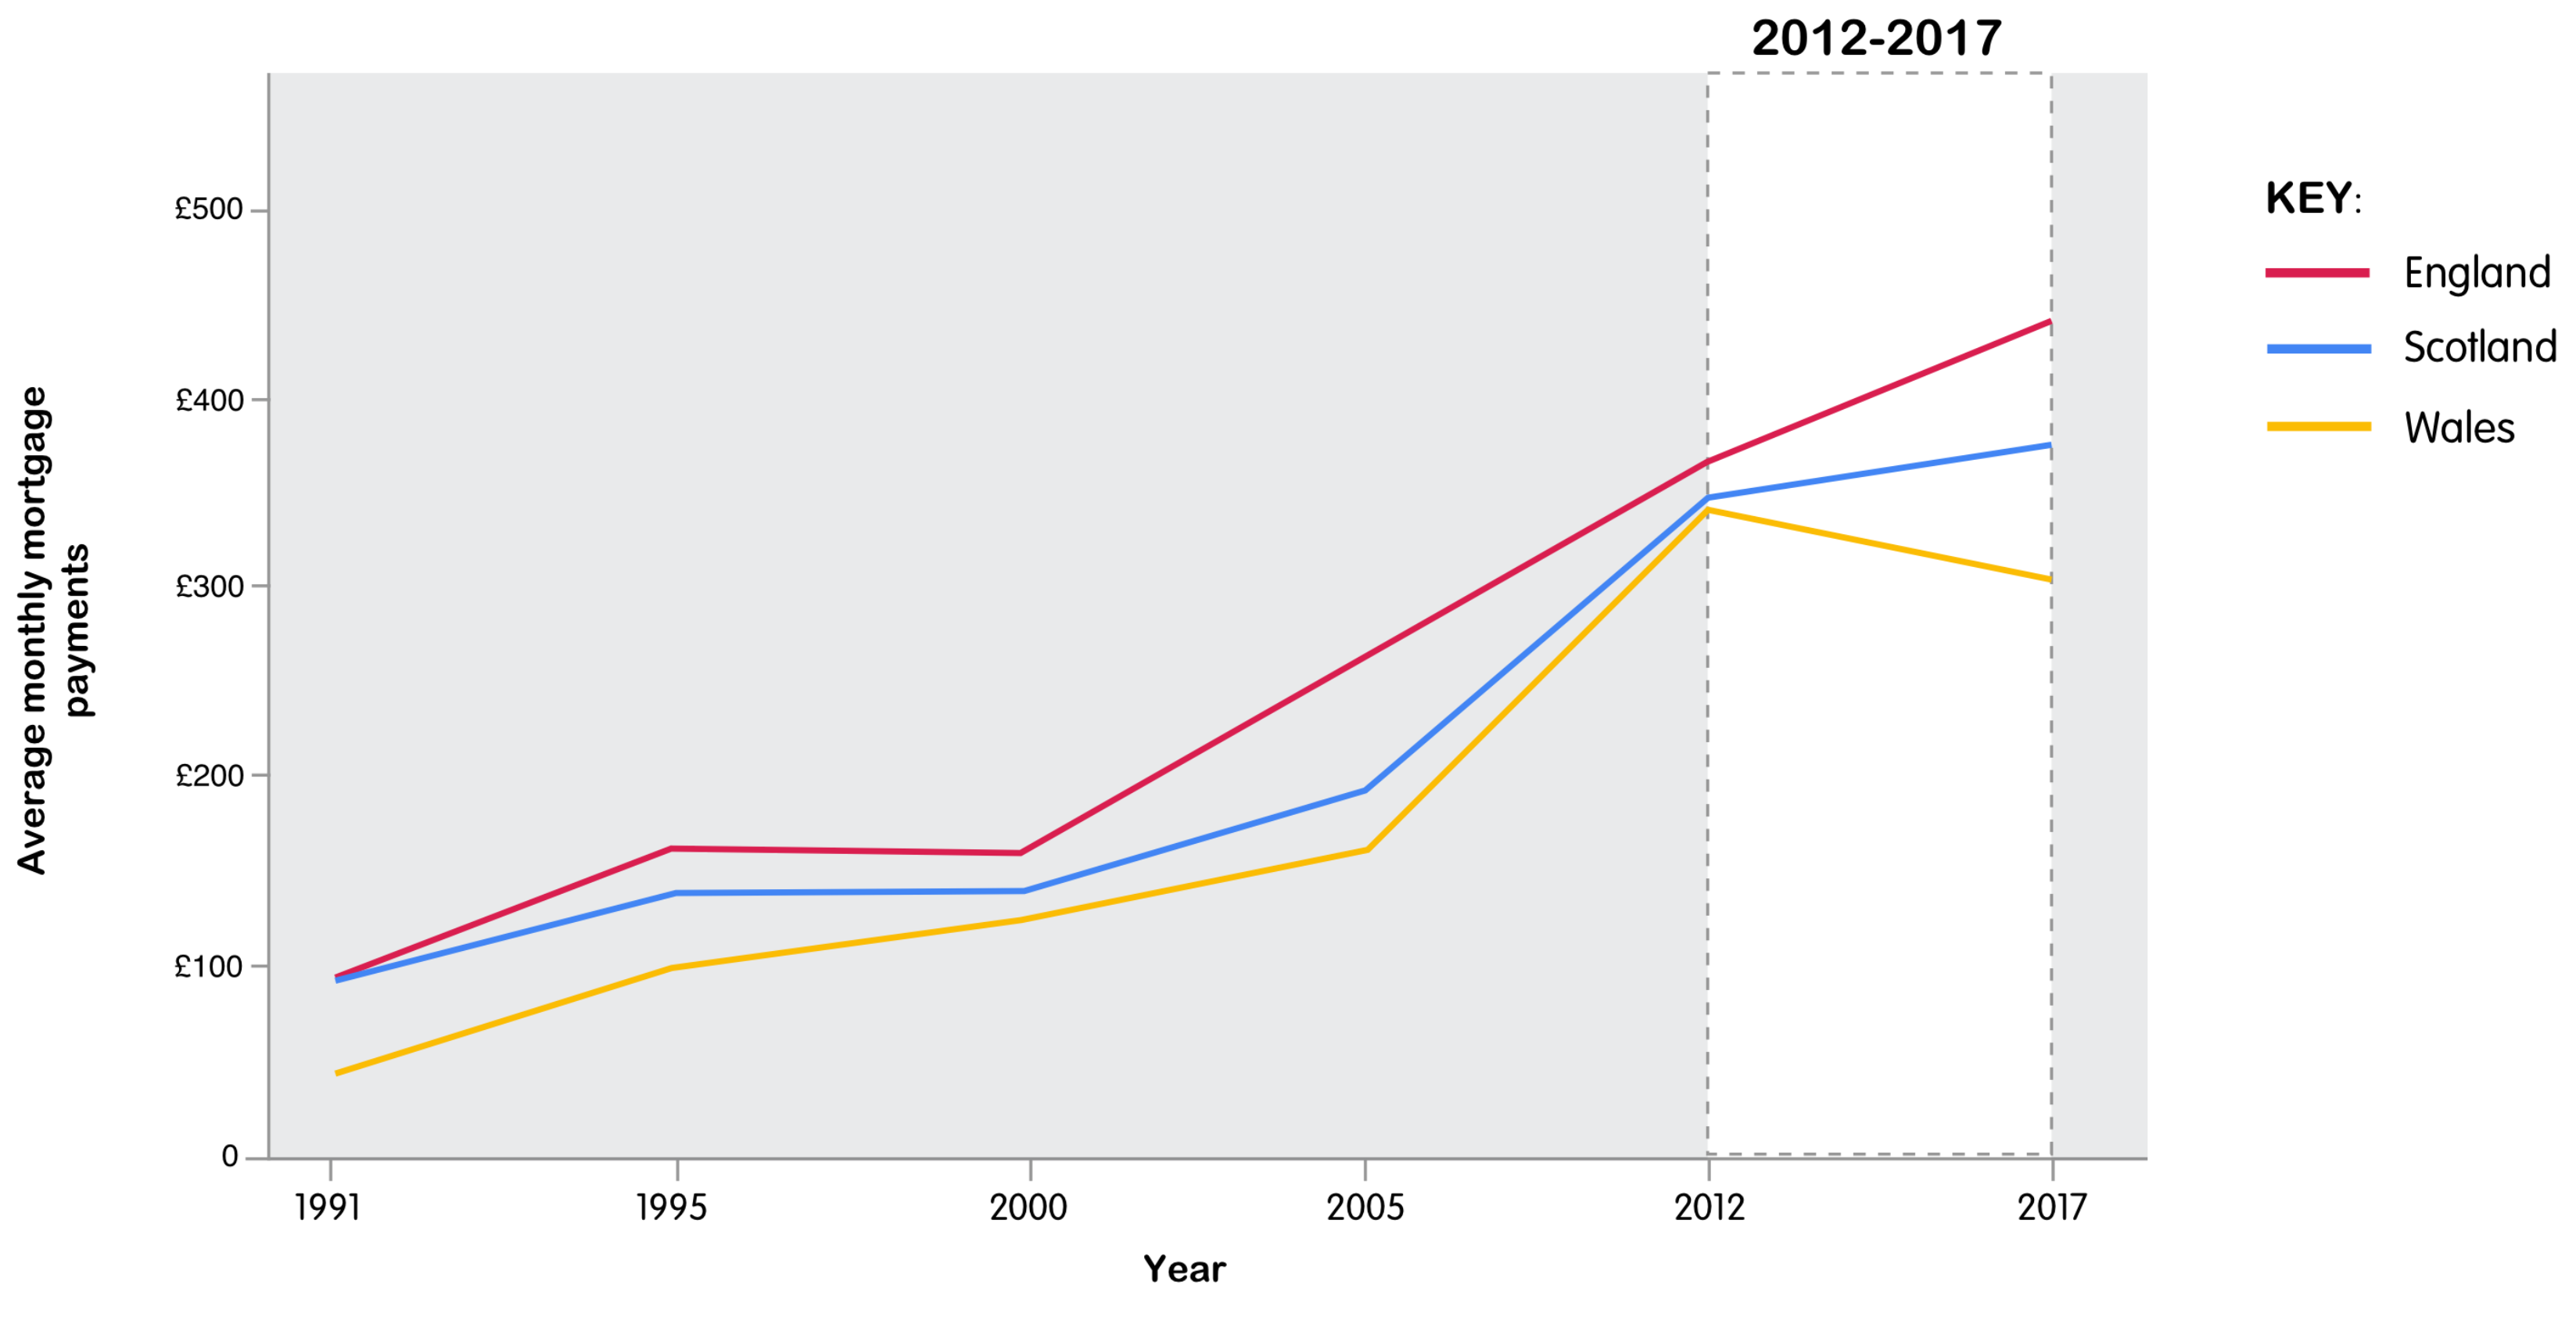
Y axis - Average monthly mortgage payments in £
X axis - By year
The North West sees the largest regional increase
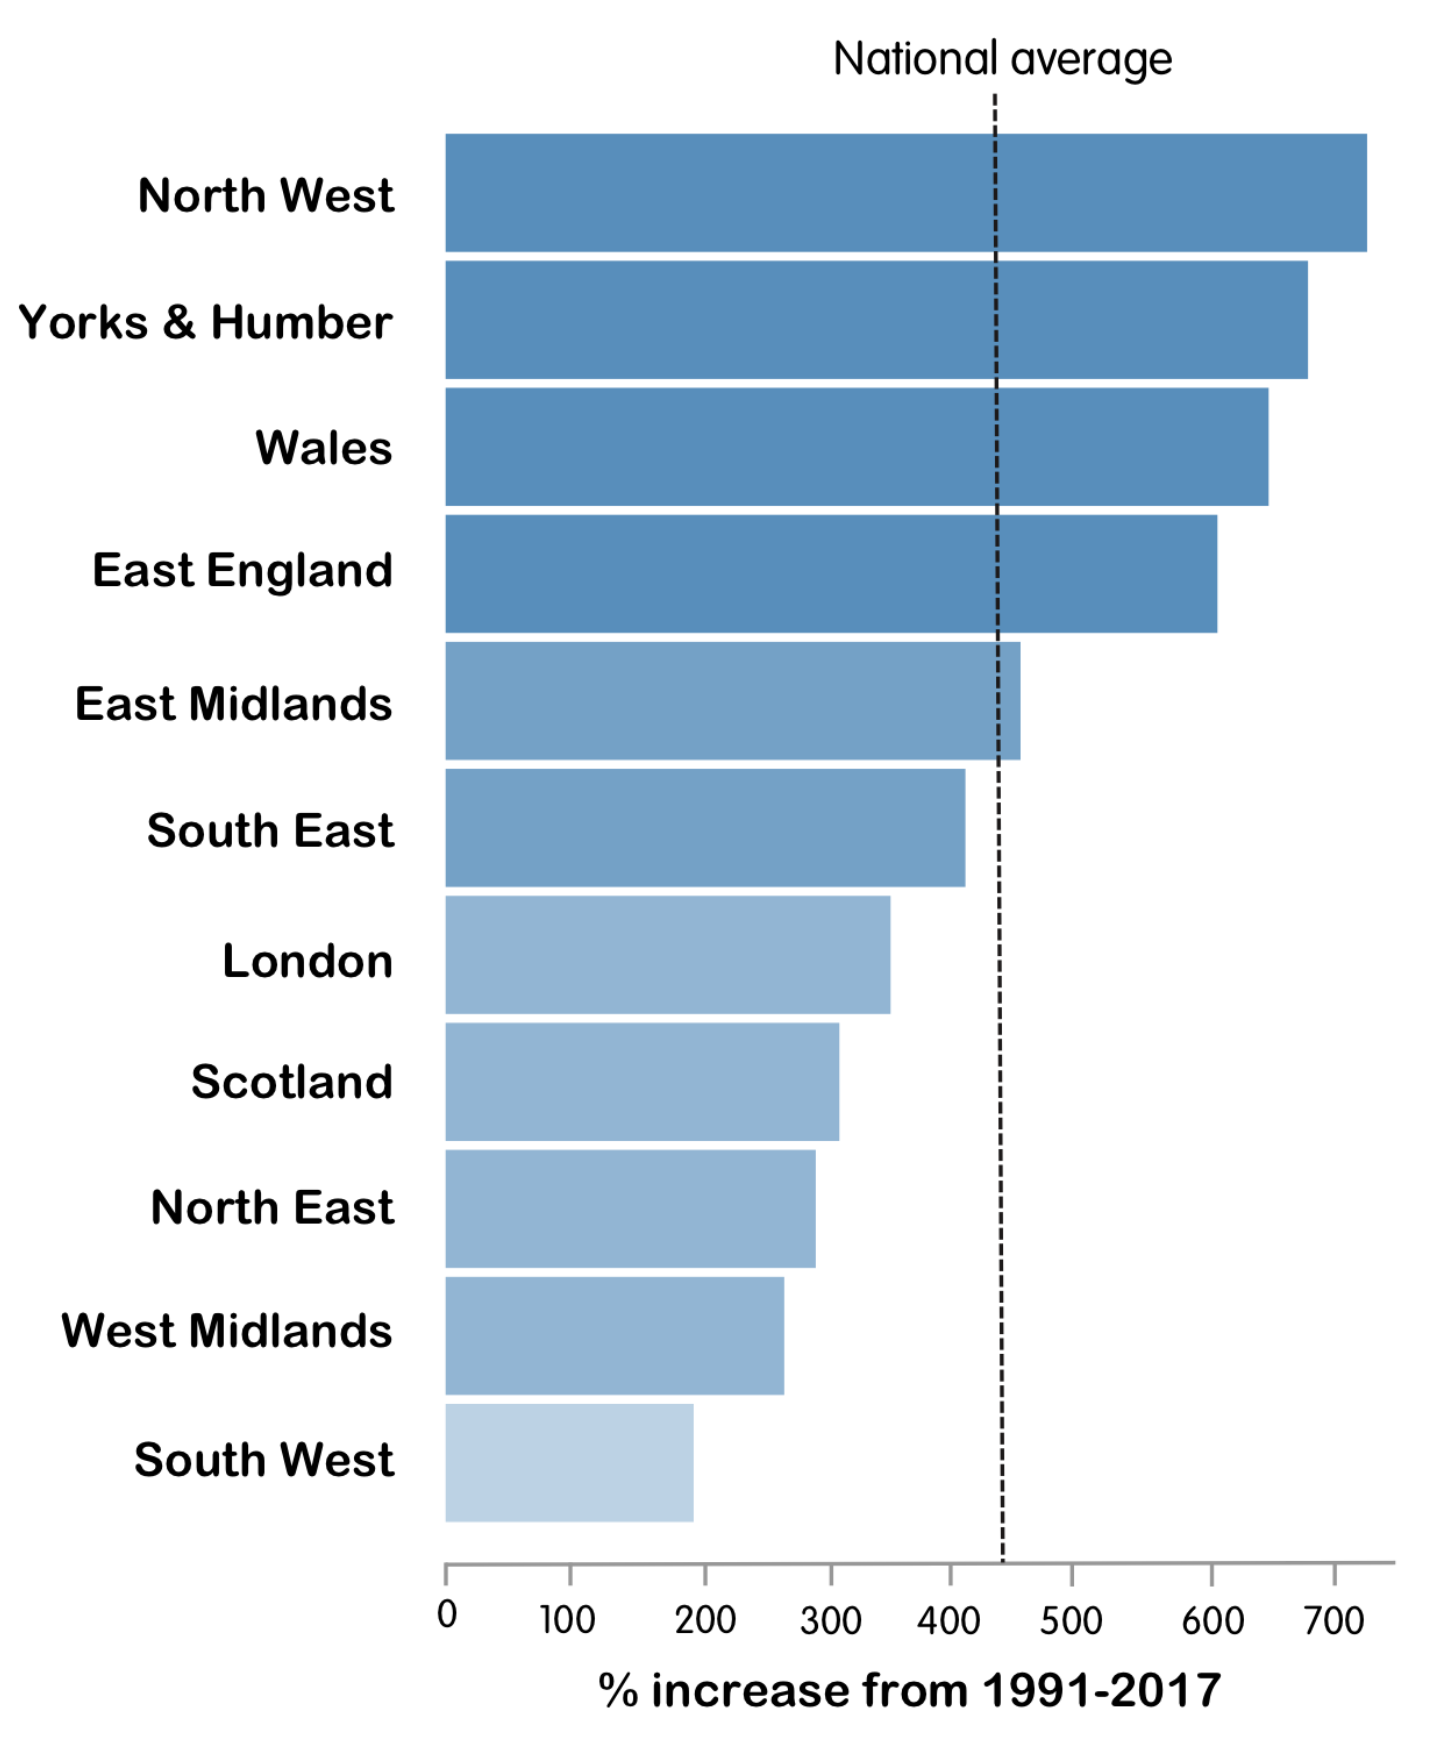
Two regions with lowest average monthly rent in 2017
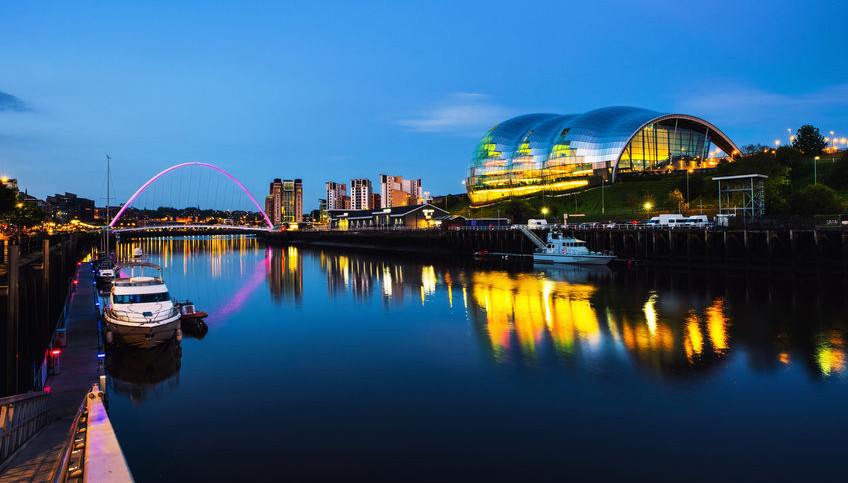
North East
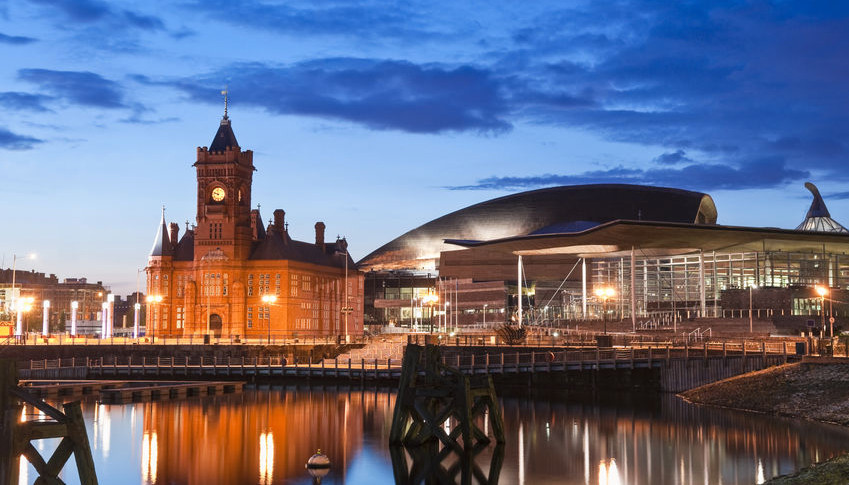
Wales

Under £300
London
Over twice as much per month...
 Savings
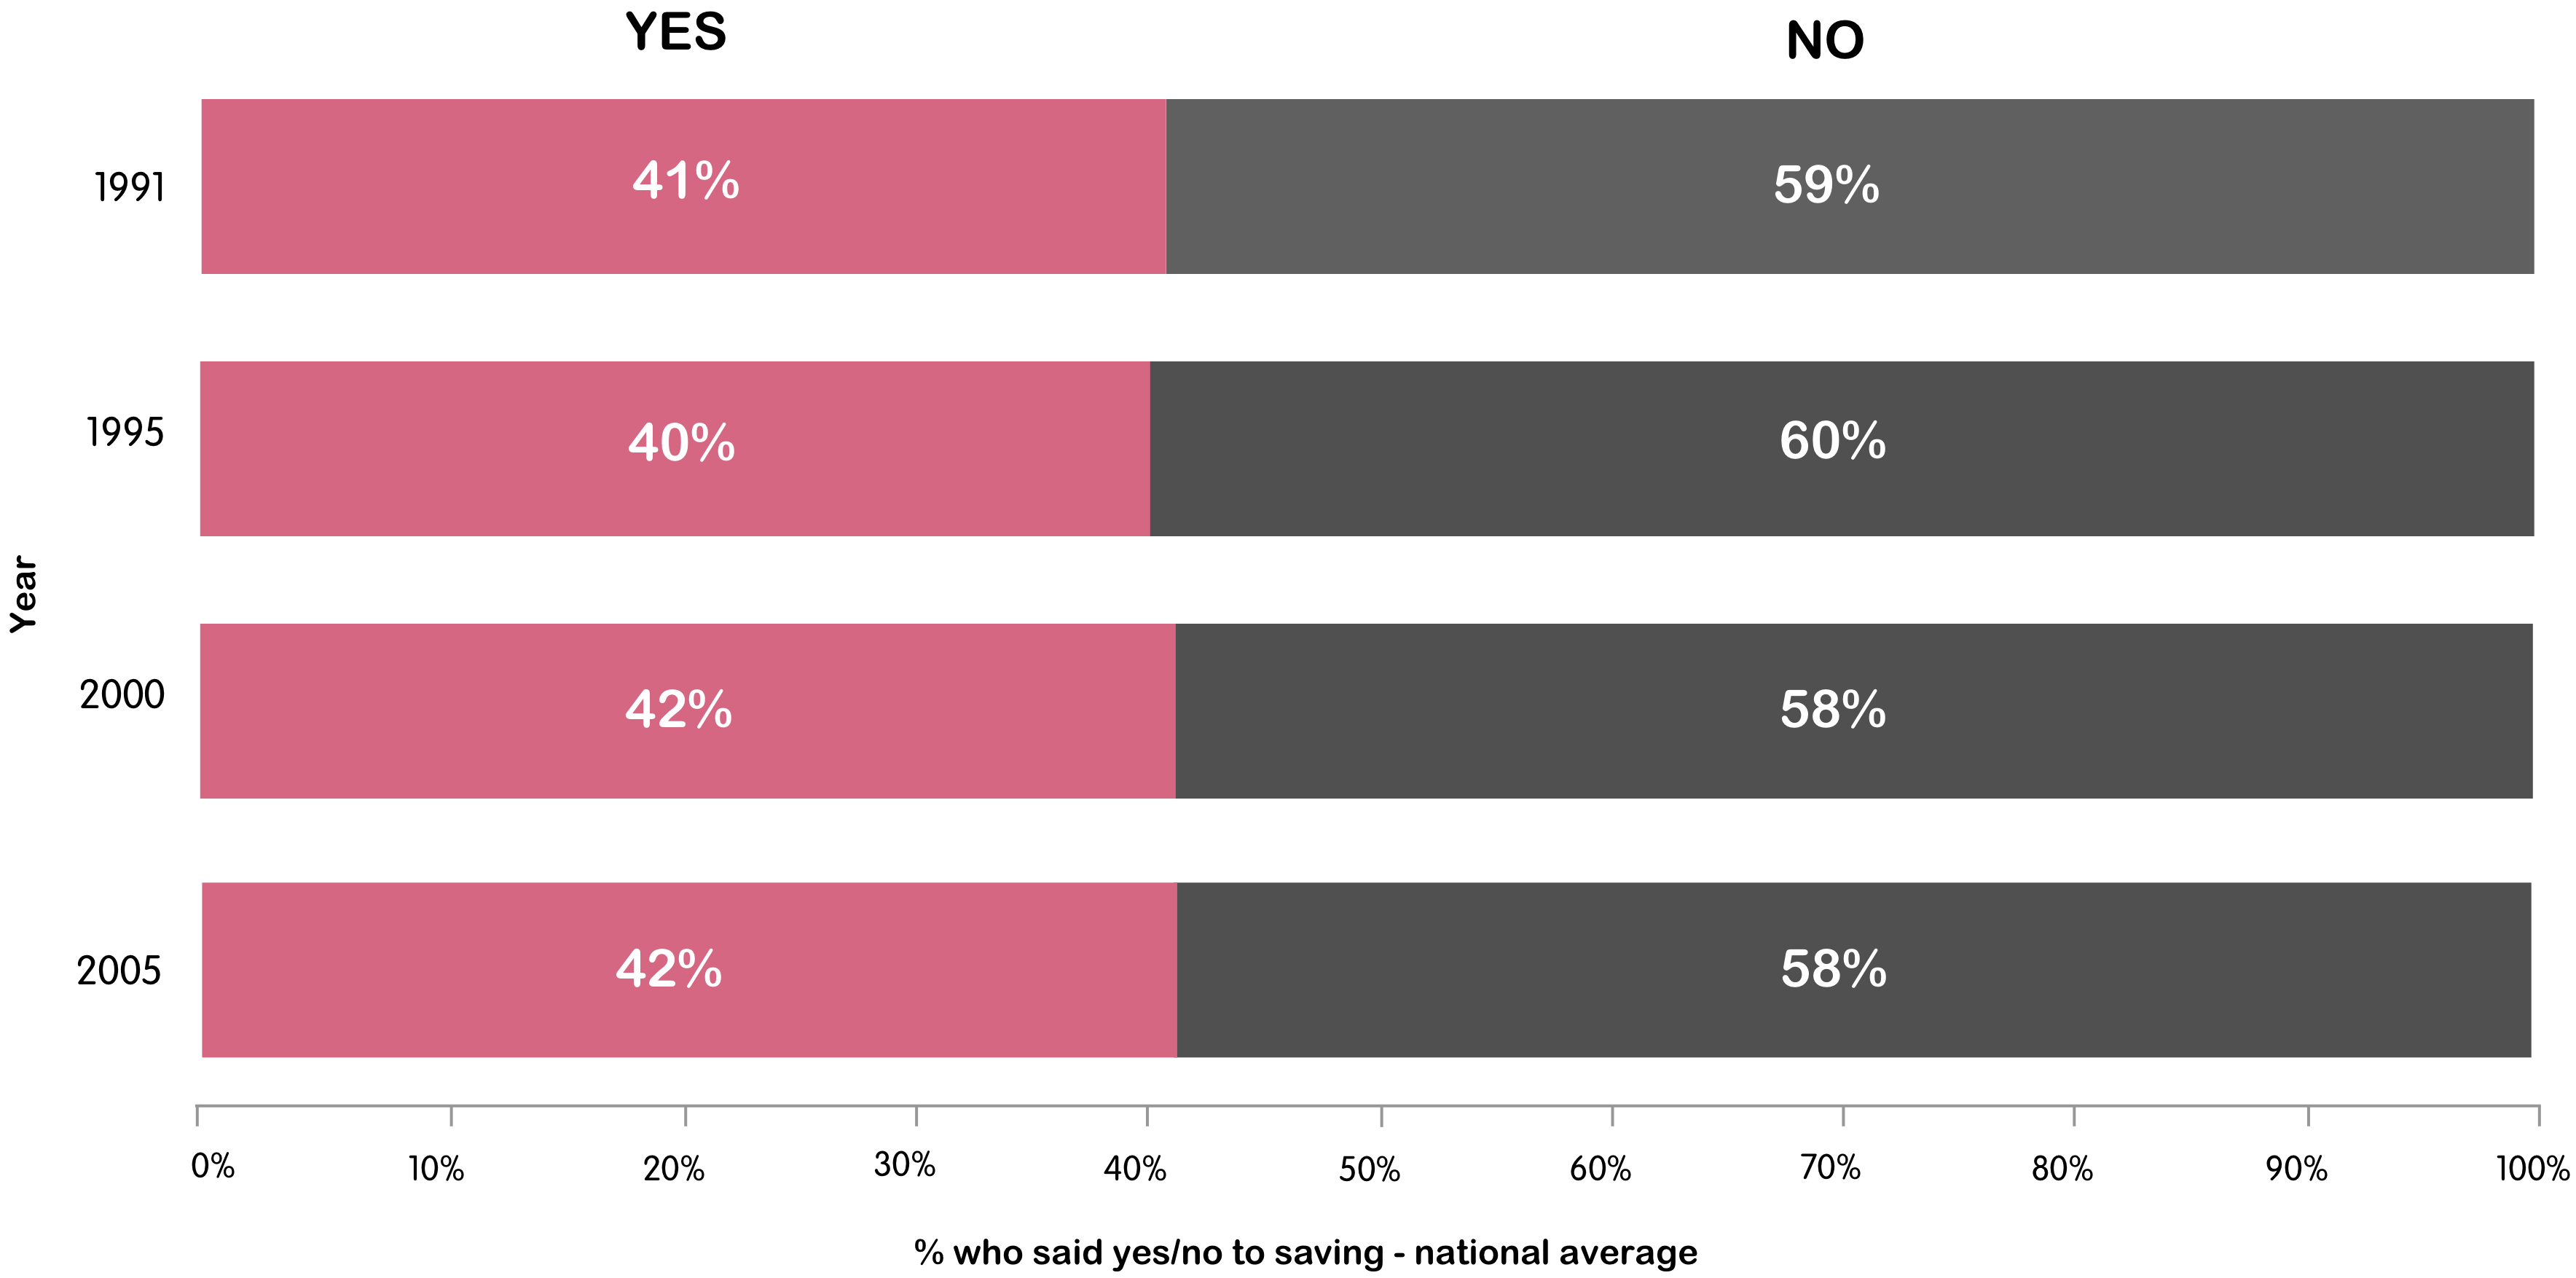
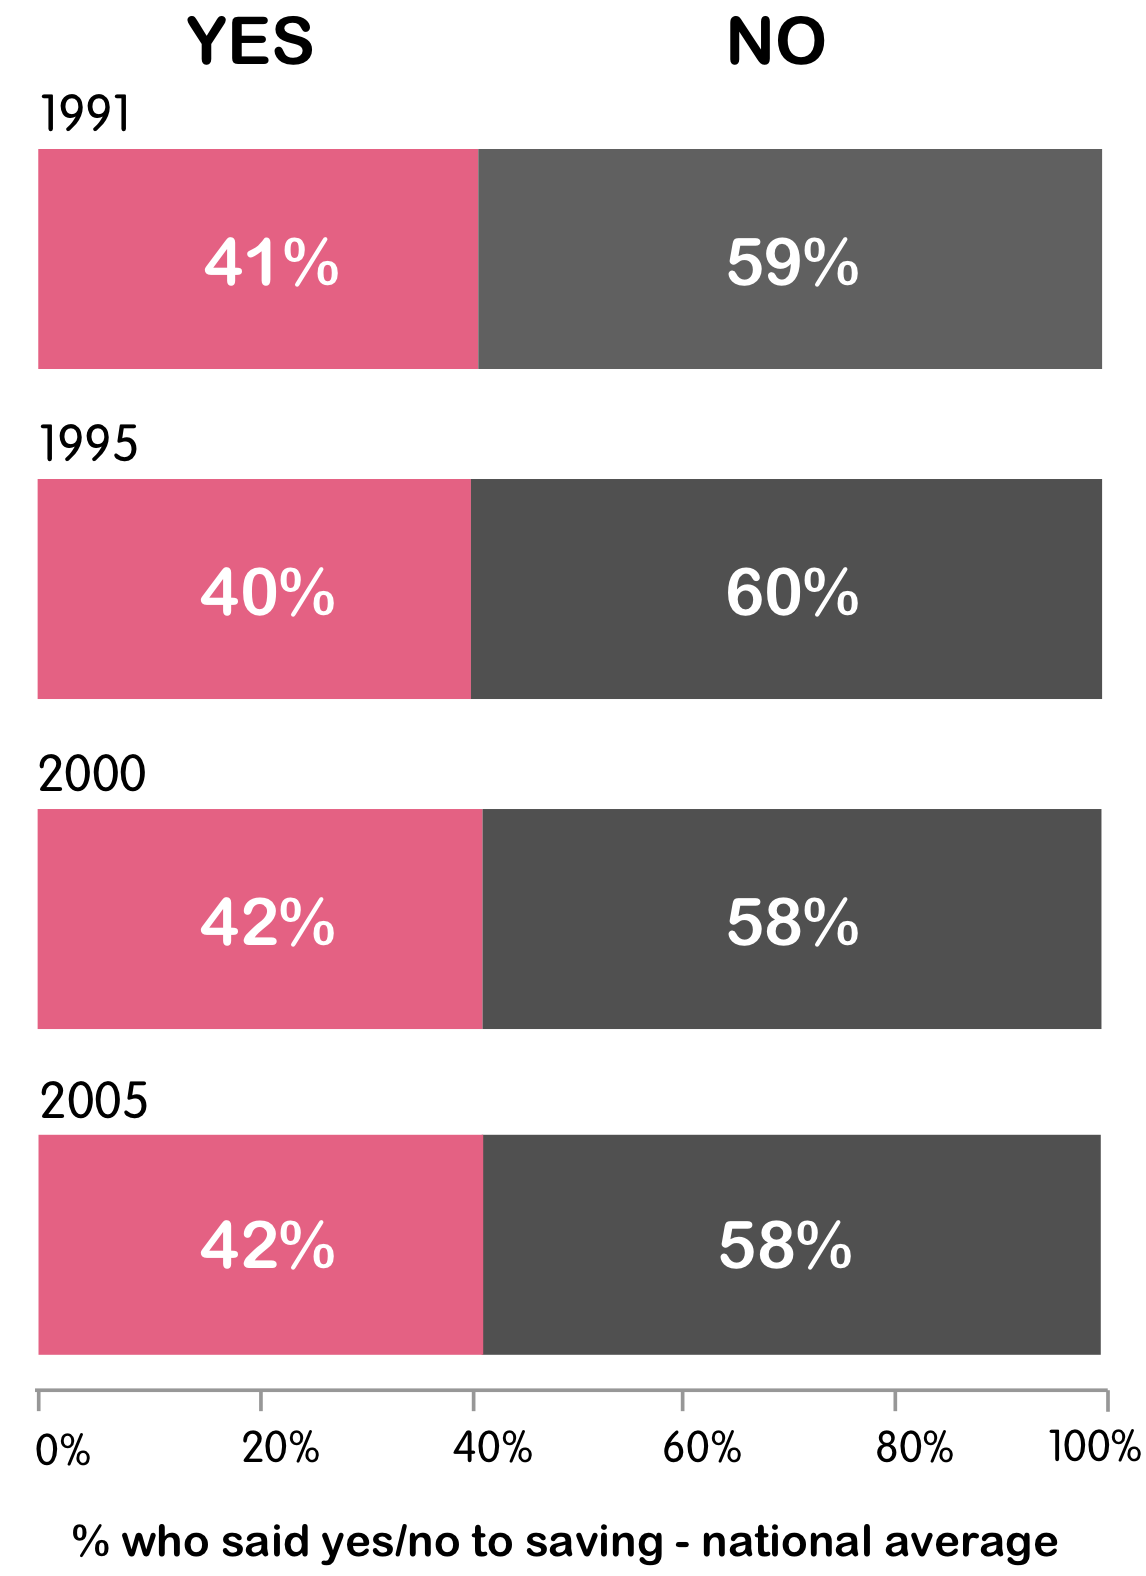
Savings haven't really changed
The % split between people who say yes they save vs those who don’t has stayed roughly the same from 1991 to 2005.
Savings haven't really changed
The % split between people who say yes they save vs those who don’t has stayed roughly the same from 1991 to 2005.
 Food
Food
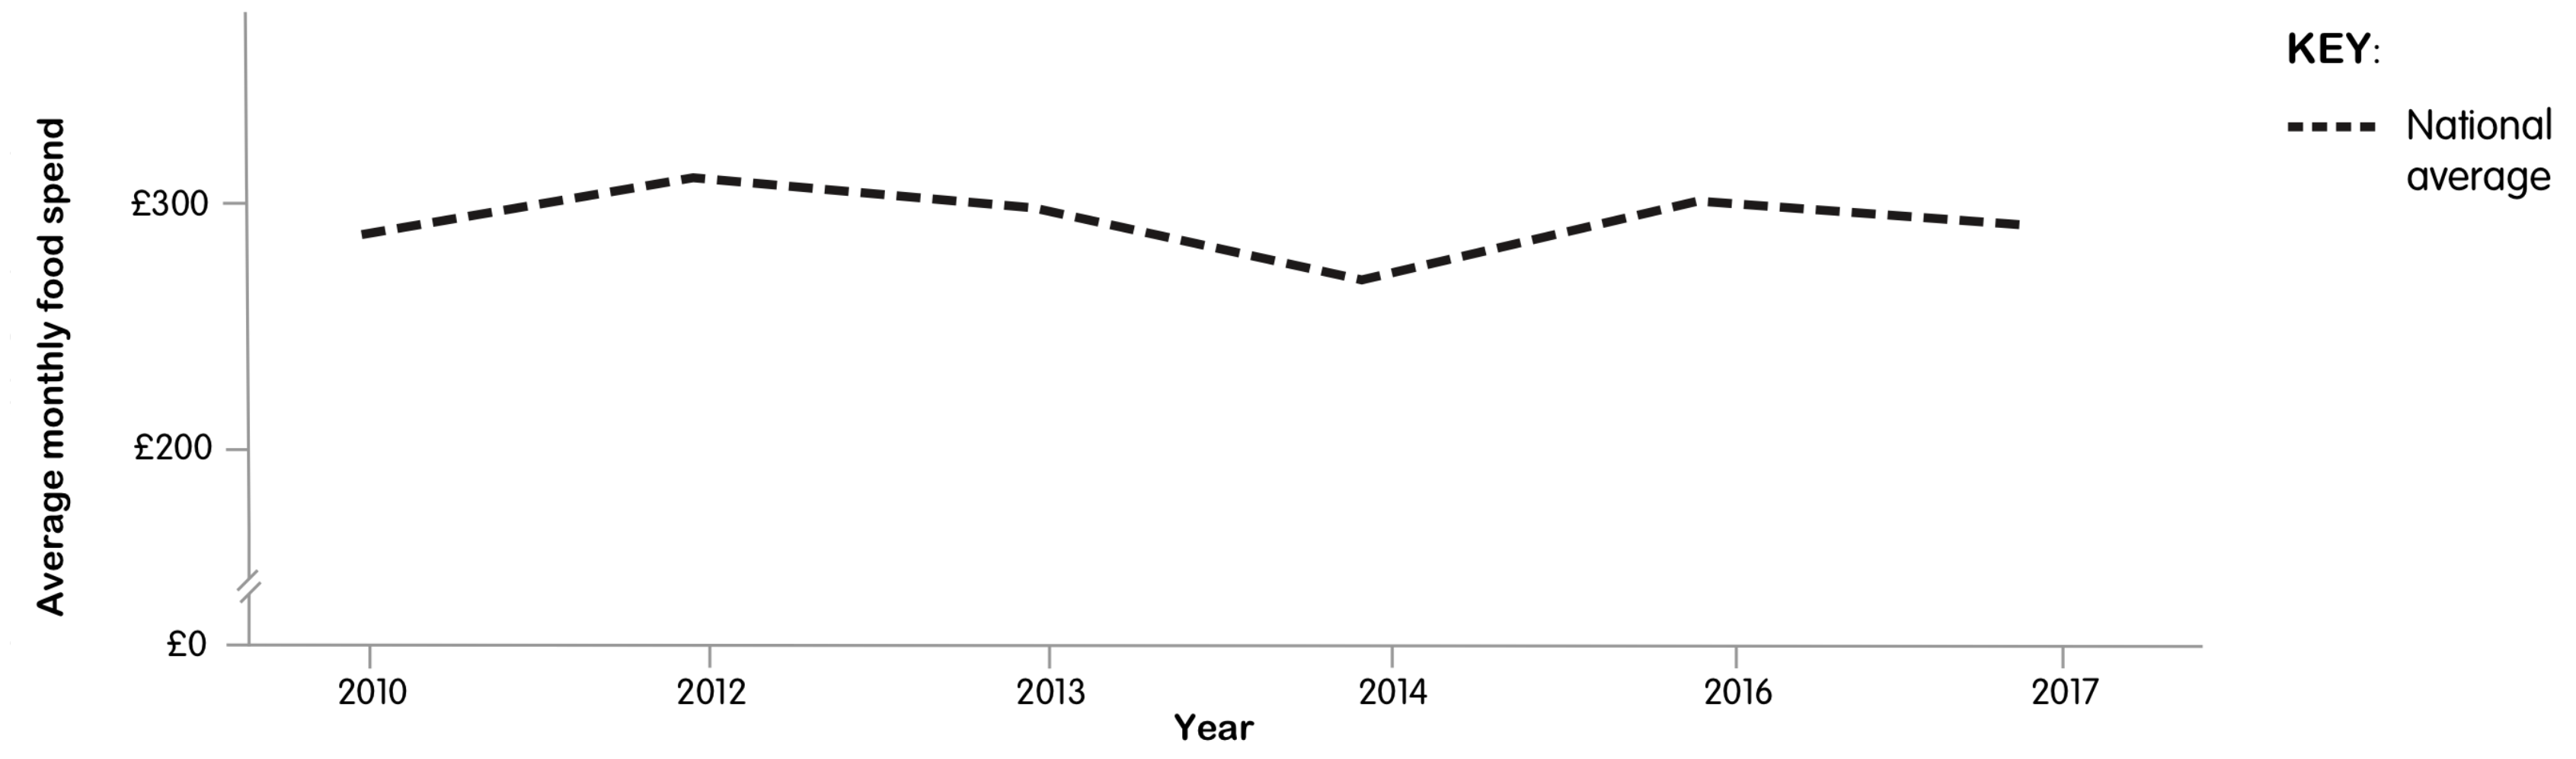
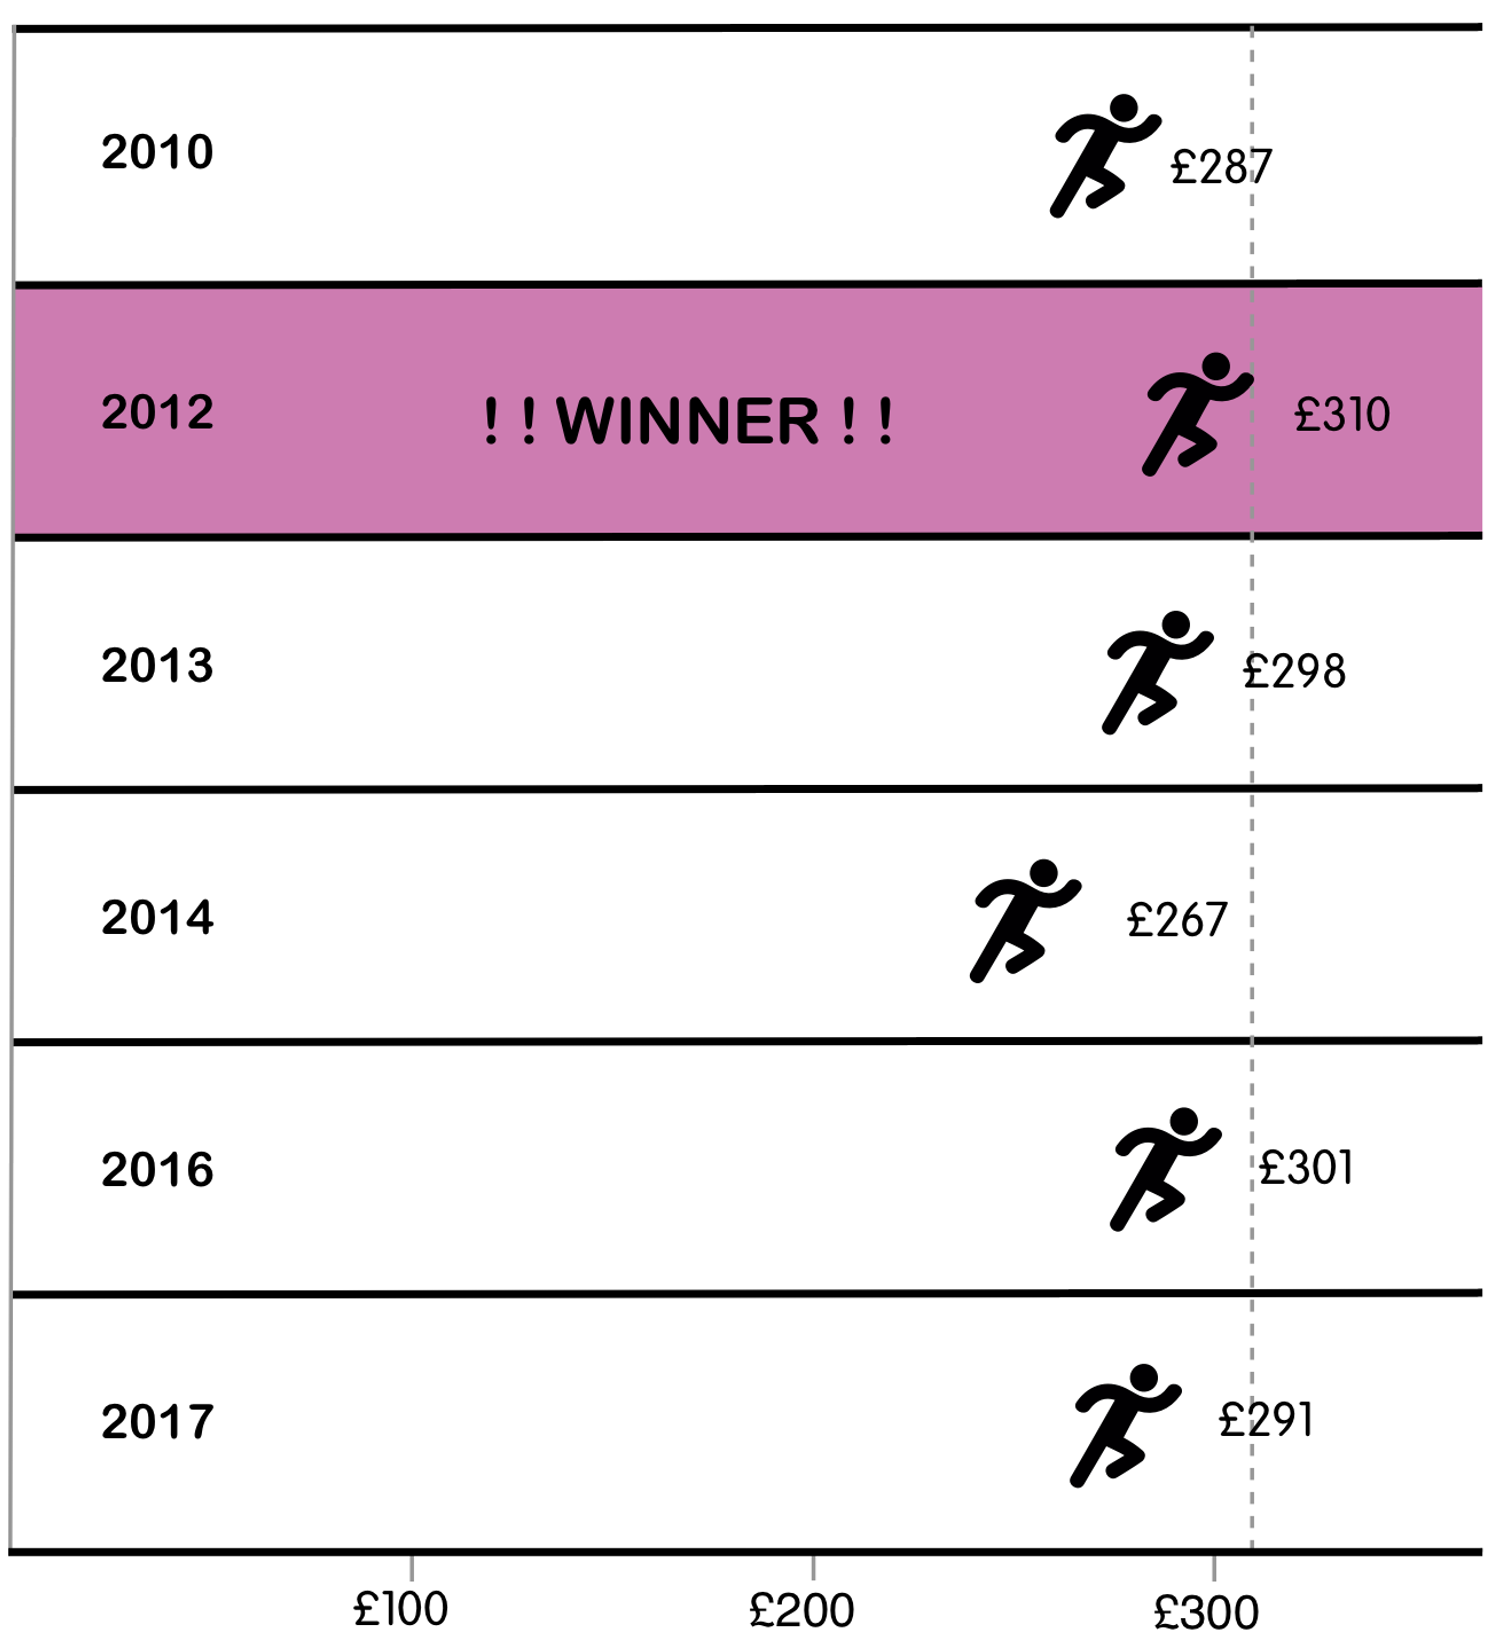
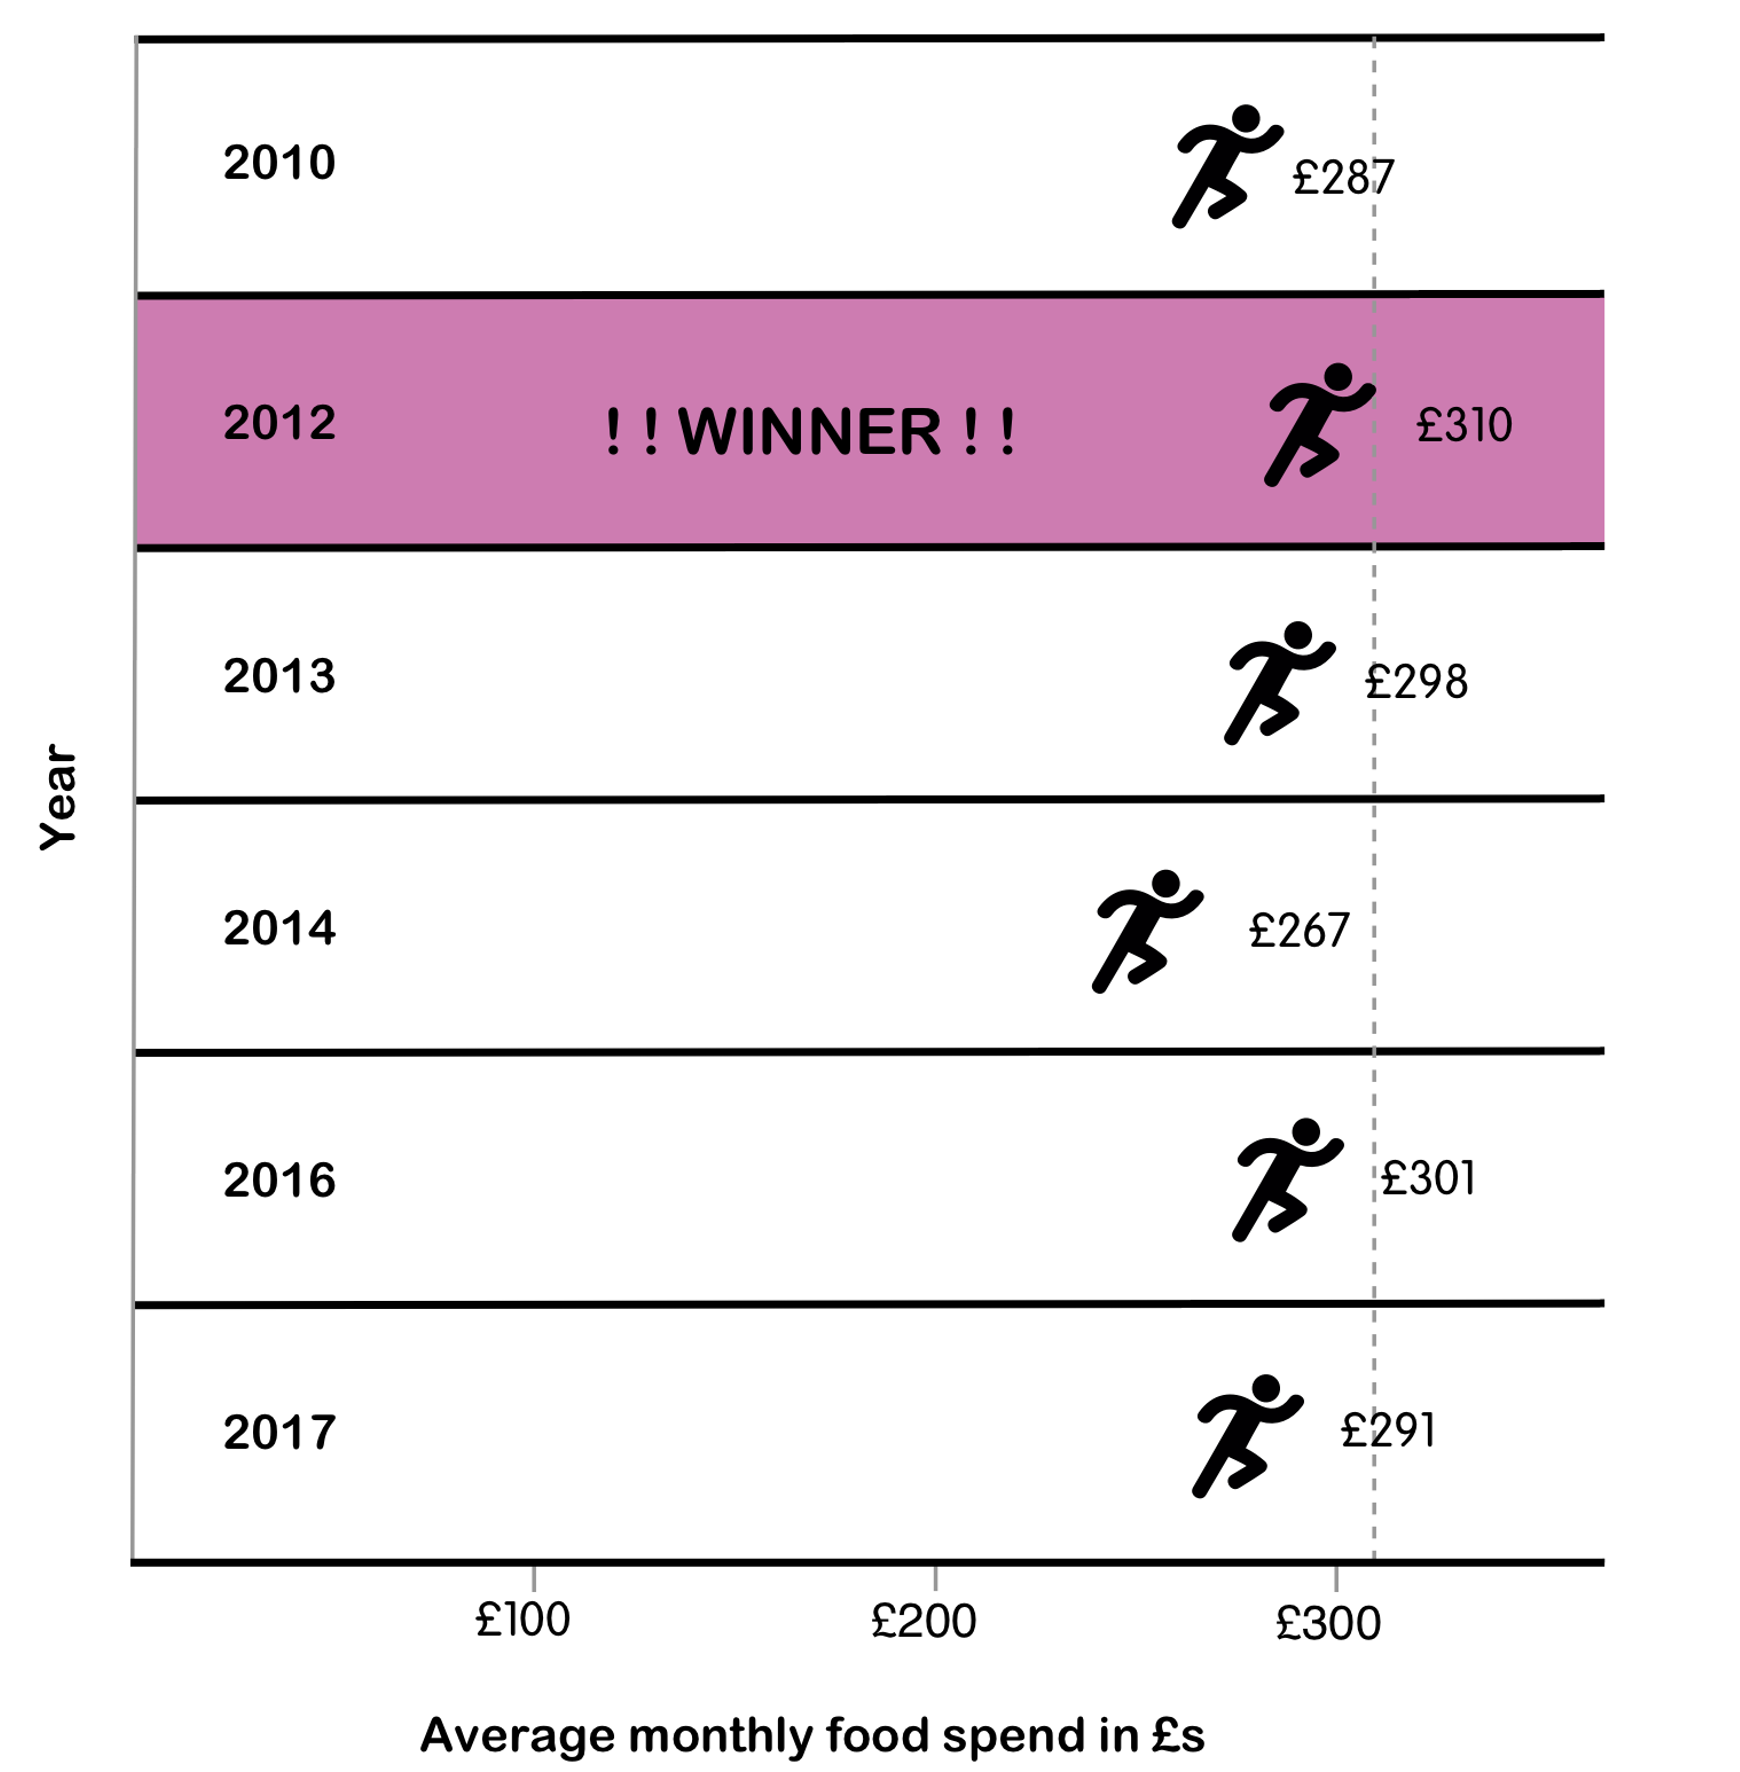
Food spending hasn't changed much in the UK overall
Between 2010 and 2017, the reported amount spent monthly on food (as a national average) has remained fairly consistent.
Change across whole timeframe
Change from 2016 to 2017
Food spending hasn't changed much in the UK overall
Between 2010 and 2017, the reported amount spent monthly on food (as a national average) has remained fairly consistent.
Y axis - Average monthly food spend in £
X axis - By year

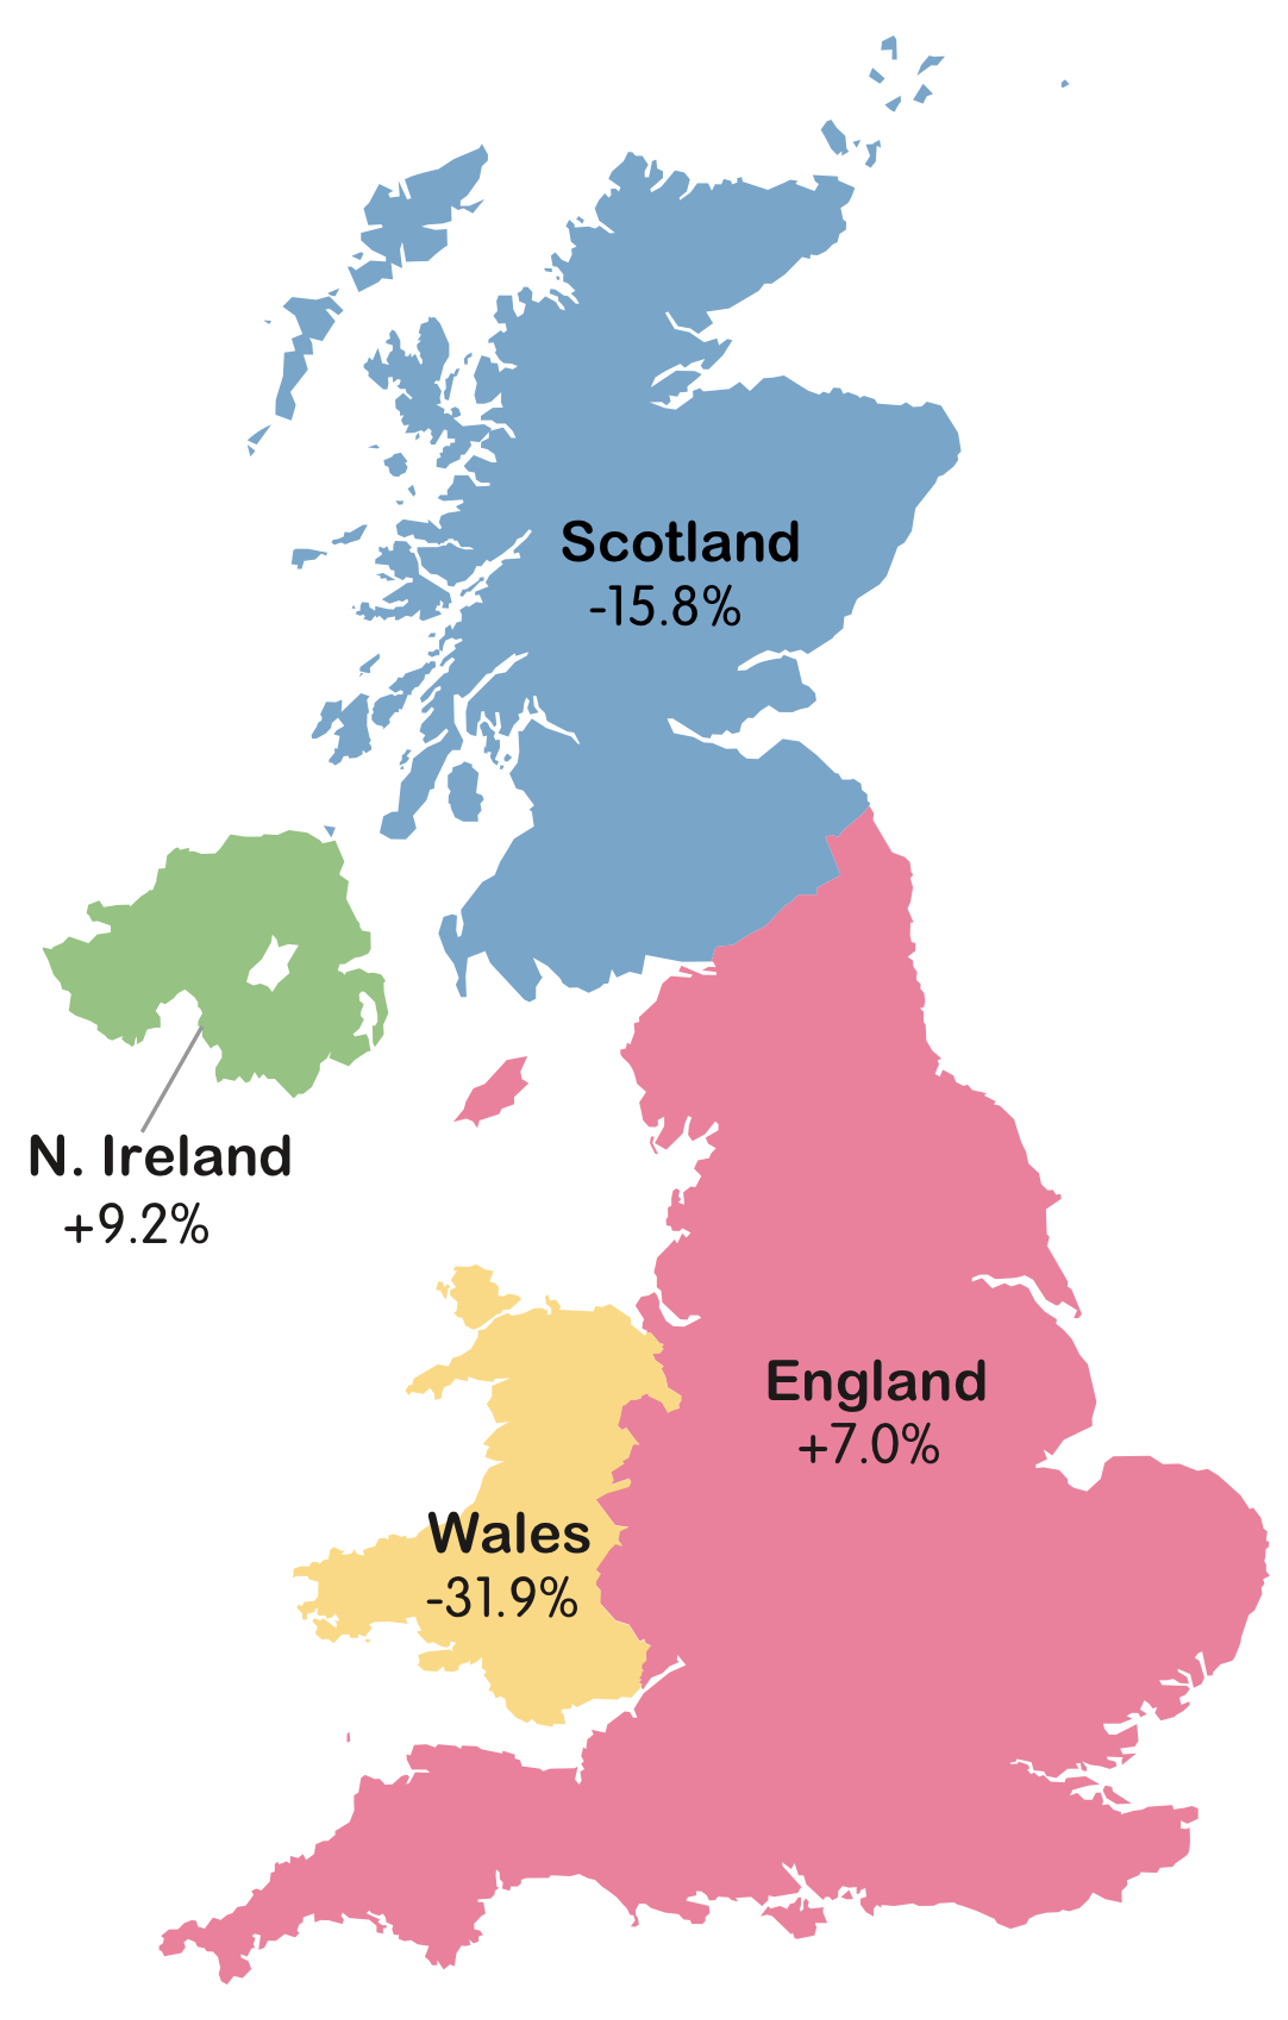
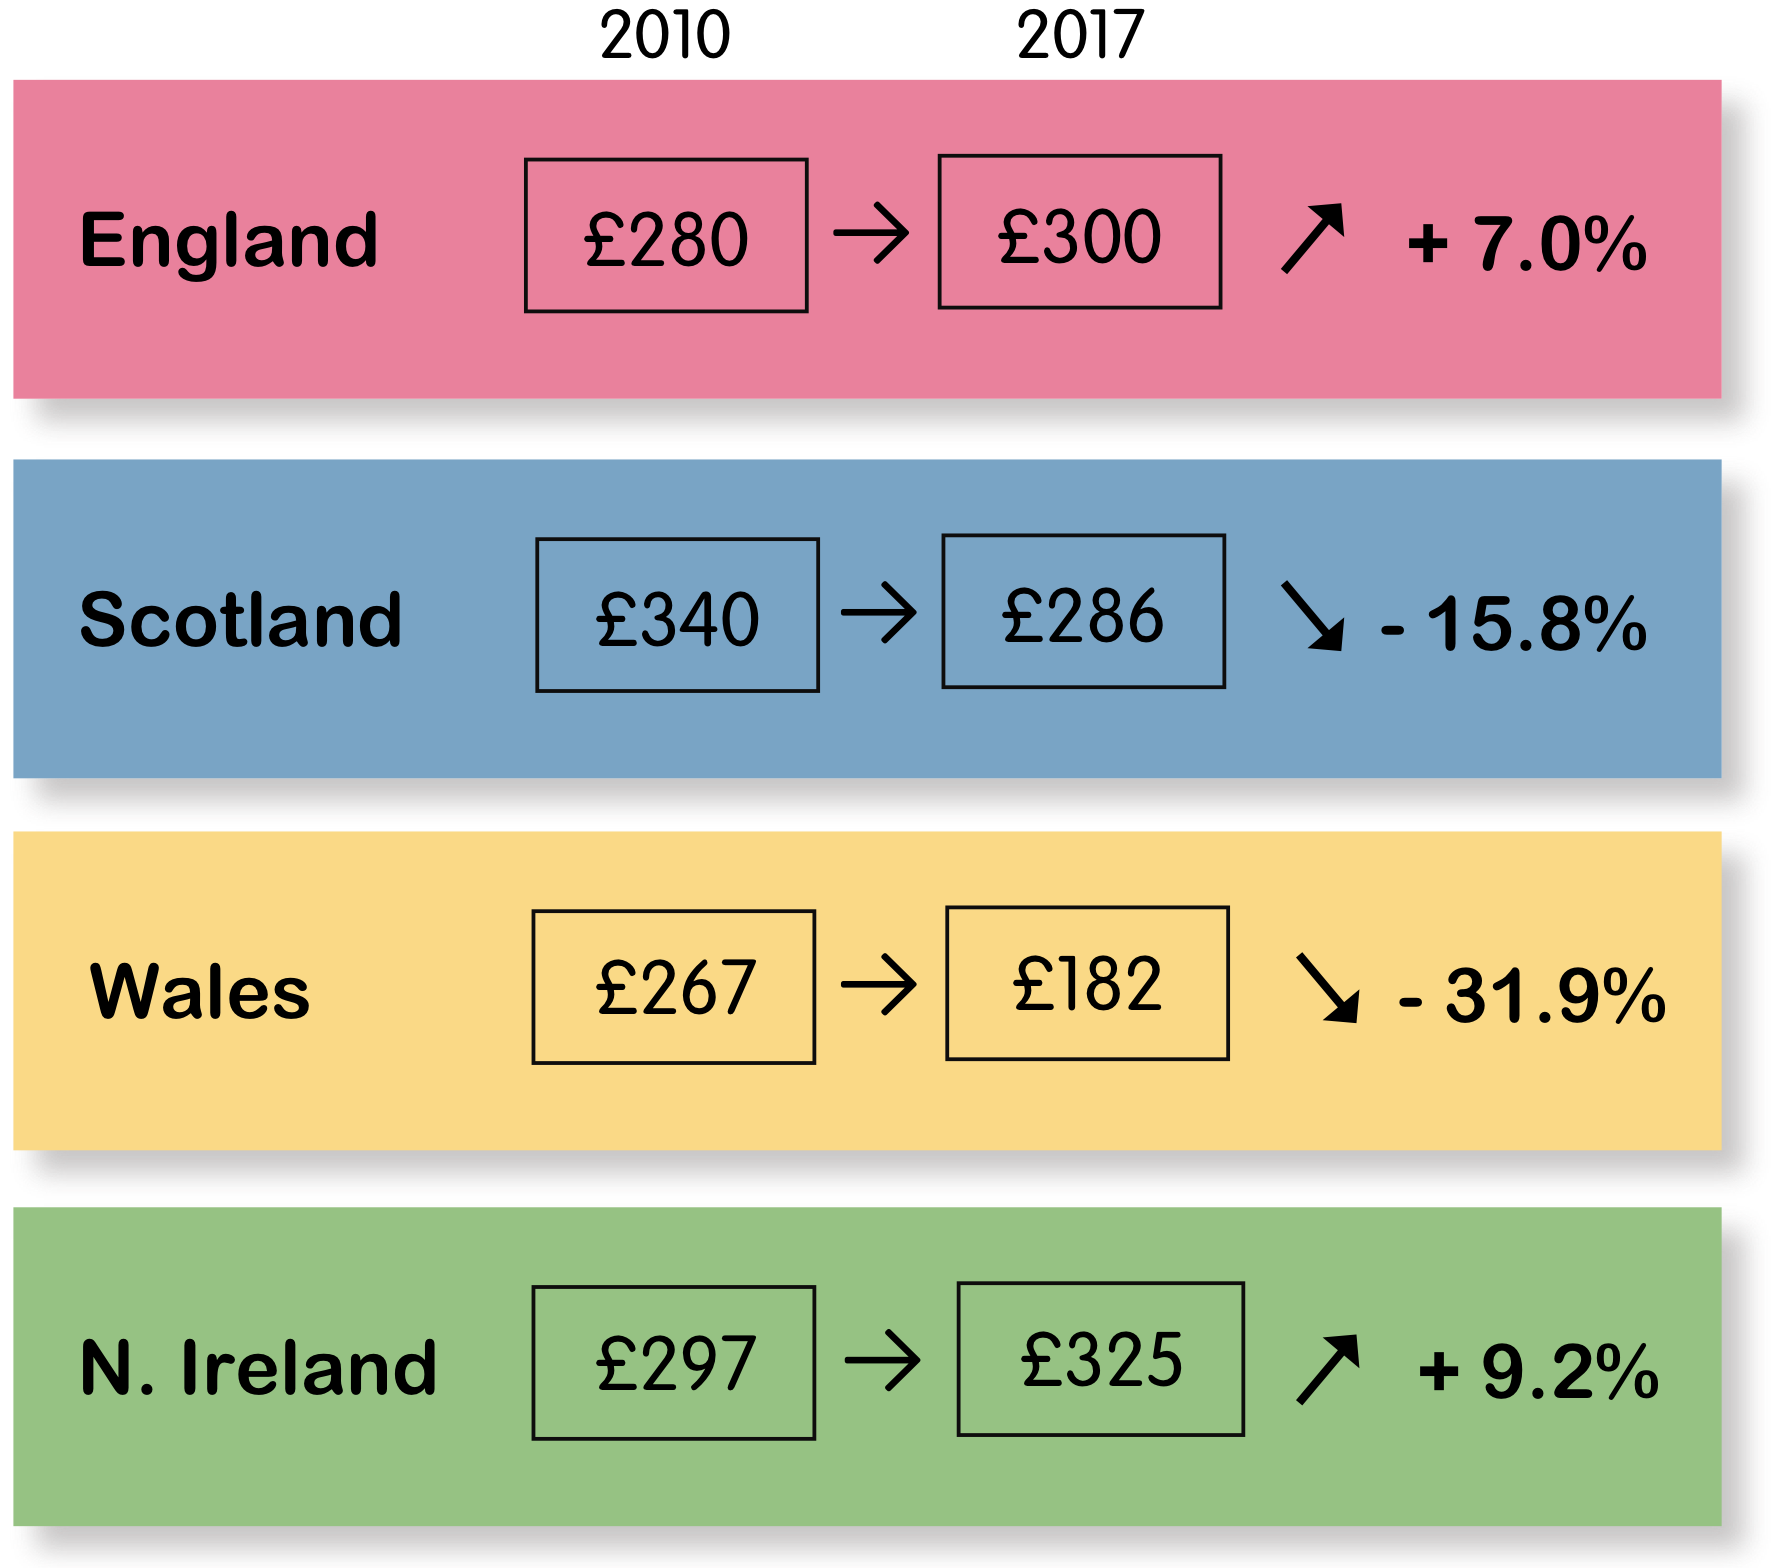
On a country level, it’s a different story
Scotland and Wales both saw a decrease in amount spent, whereas Northern Ireland and England both saw increases!
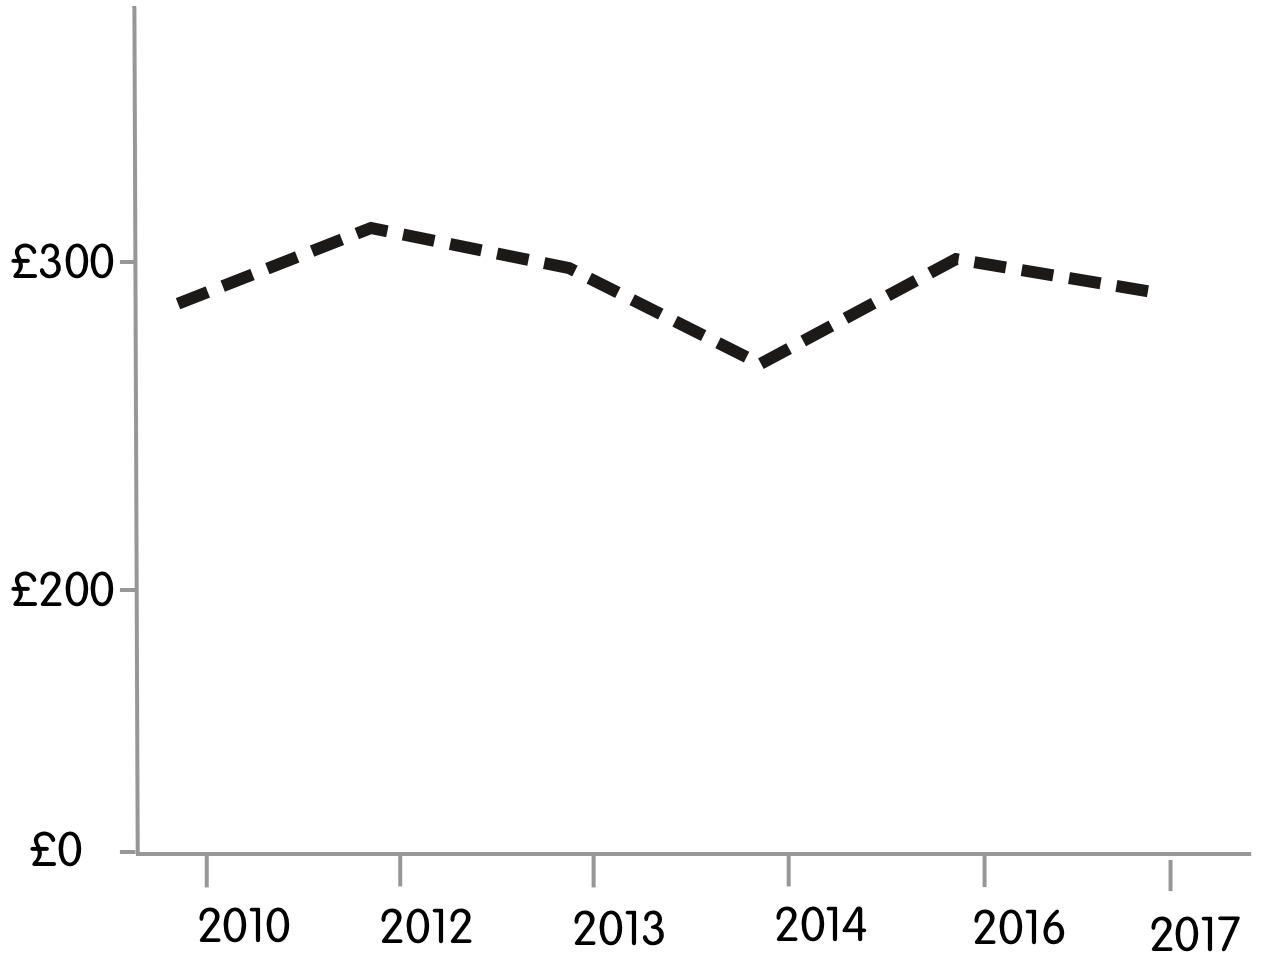
2012 saw the highest amount spent
This was the year of the Olympics...
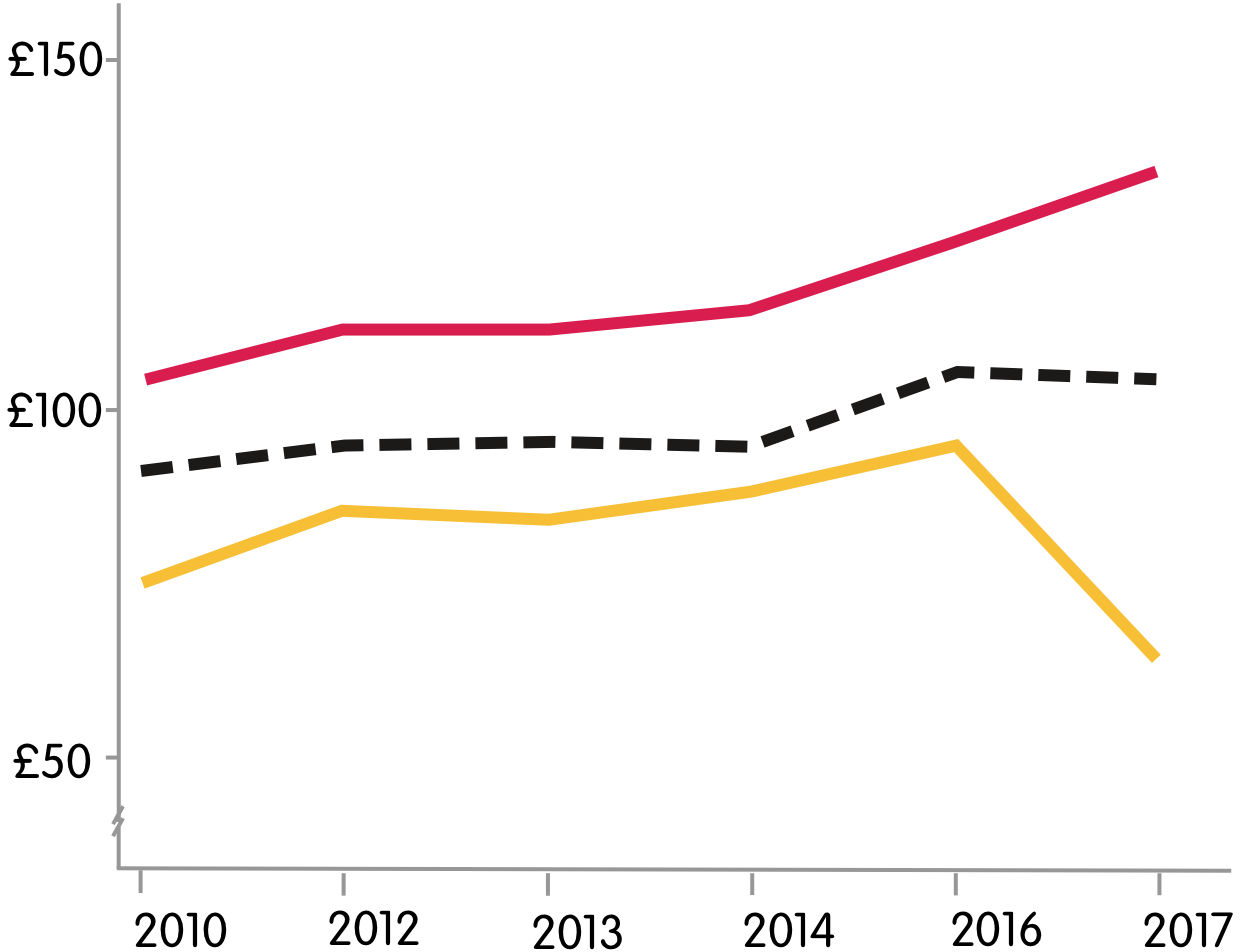
On eating out, London spent the most
In 2017, London spent £139 monthly on eating out, compared with Wales who spent just £59 on average monthly.

Y axis - Average eating out spend in £
X axis - By year
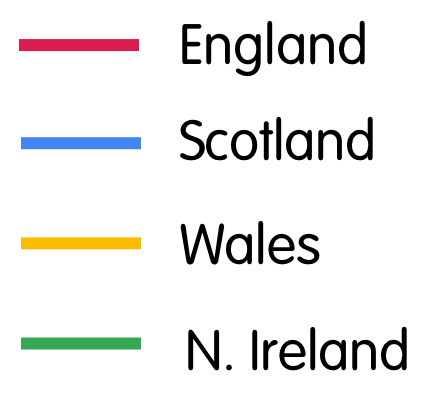
 Alcohol
Wales and N.Ireland have seen big changes lately
While the amount spent in England and Scotland has remained relatively stable from 2017 to 2018.
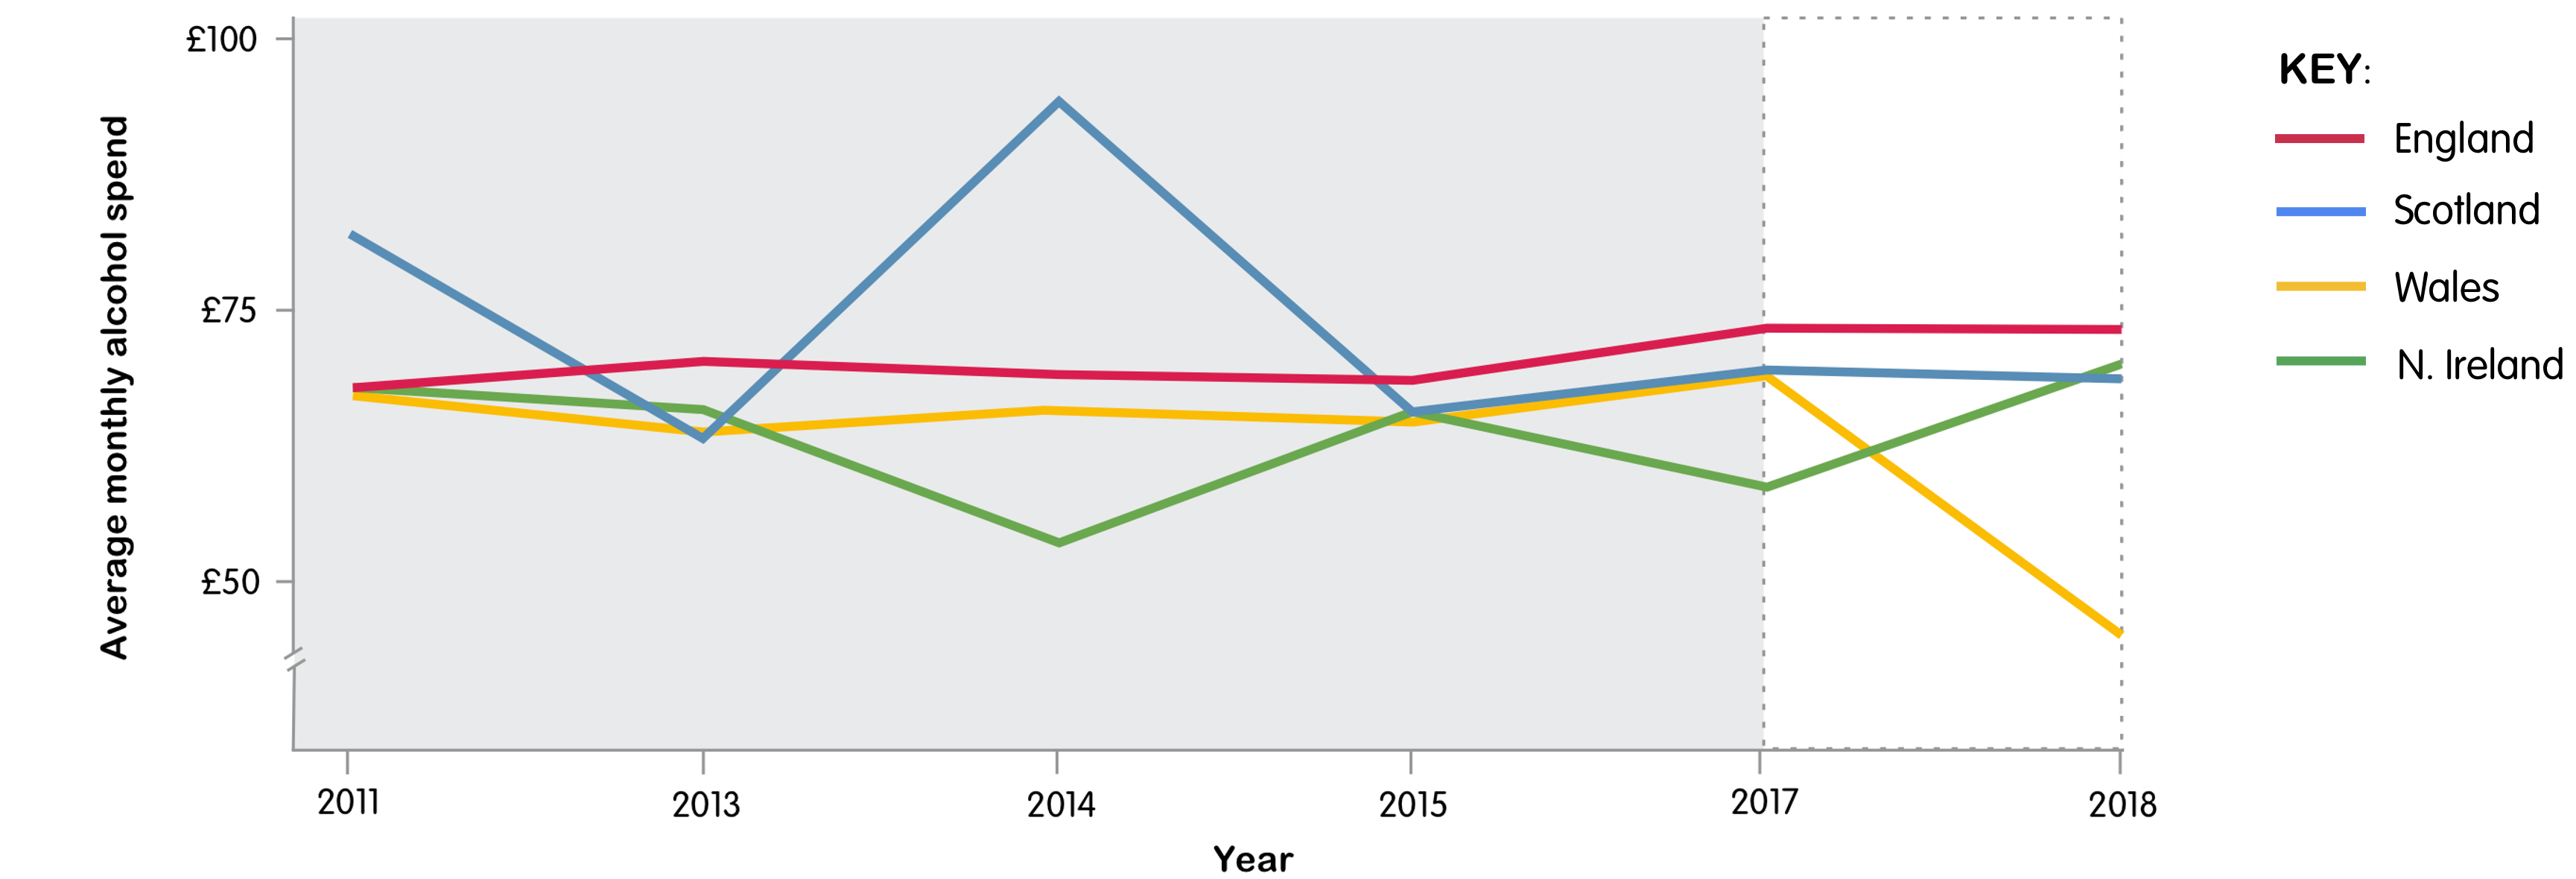
Wales - steepest decline
Northern Ireland - steepest increase
Wales and N.Ireland have seen big changes lately
While the amount spent in England and Scotland has remained relatively stable from 2017 to 2018.
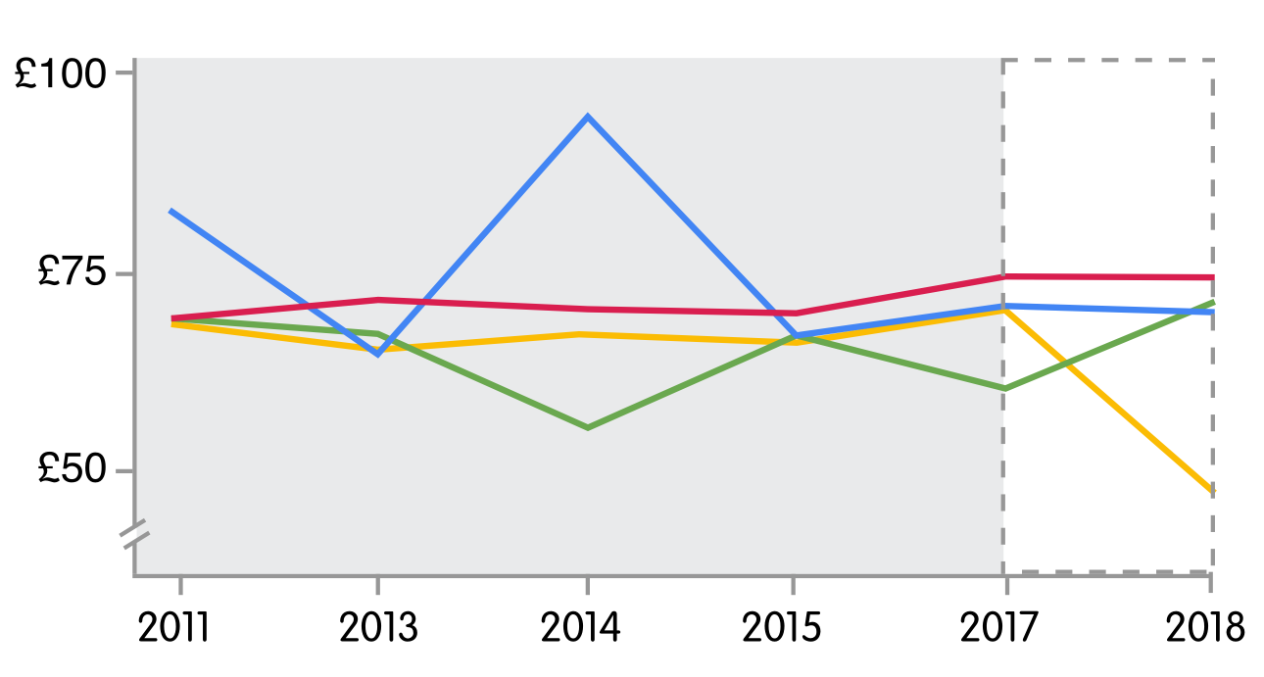
Y axis - Average monthly alcohol spend in £
X axis - By year
Wales - steepest decline
Northern Ireland - steepest increase
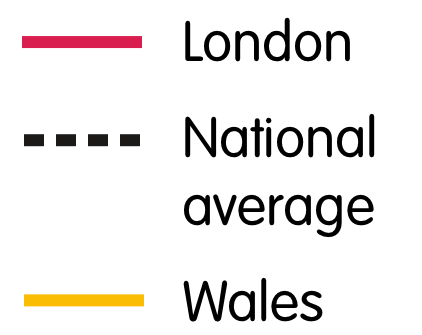
London and the North East are highest spenders
Both London and the North East are consistently spending more than the national average.
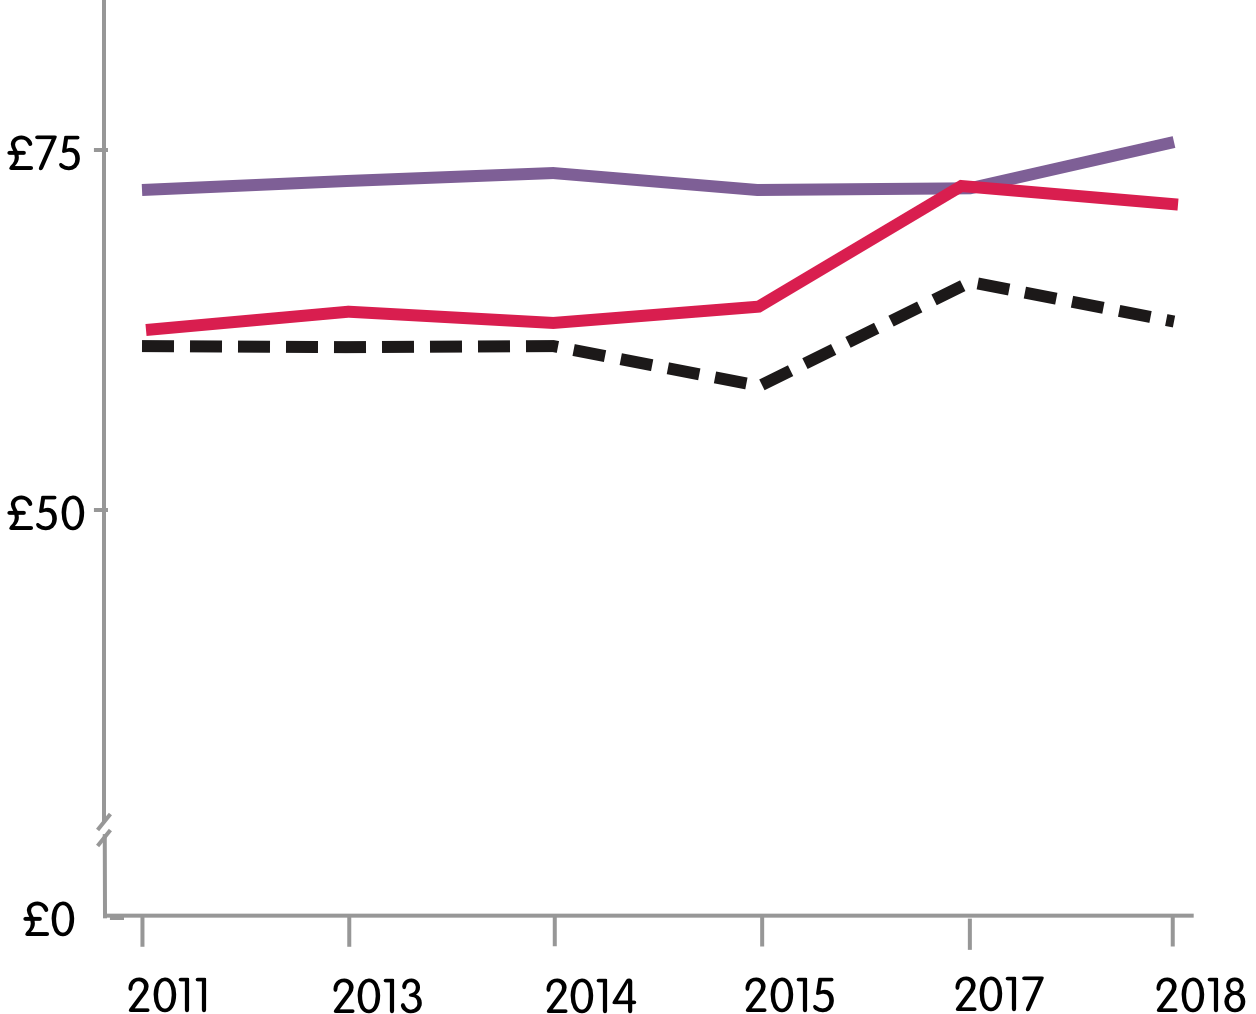
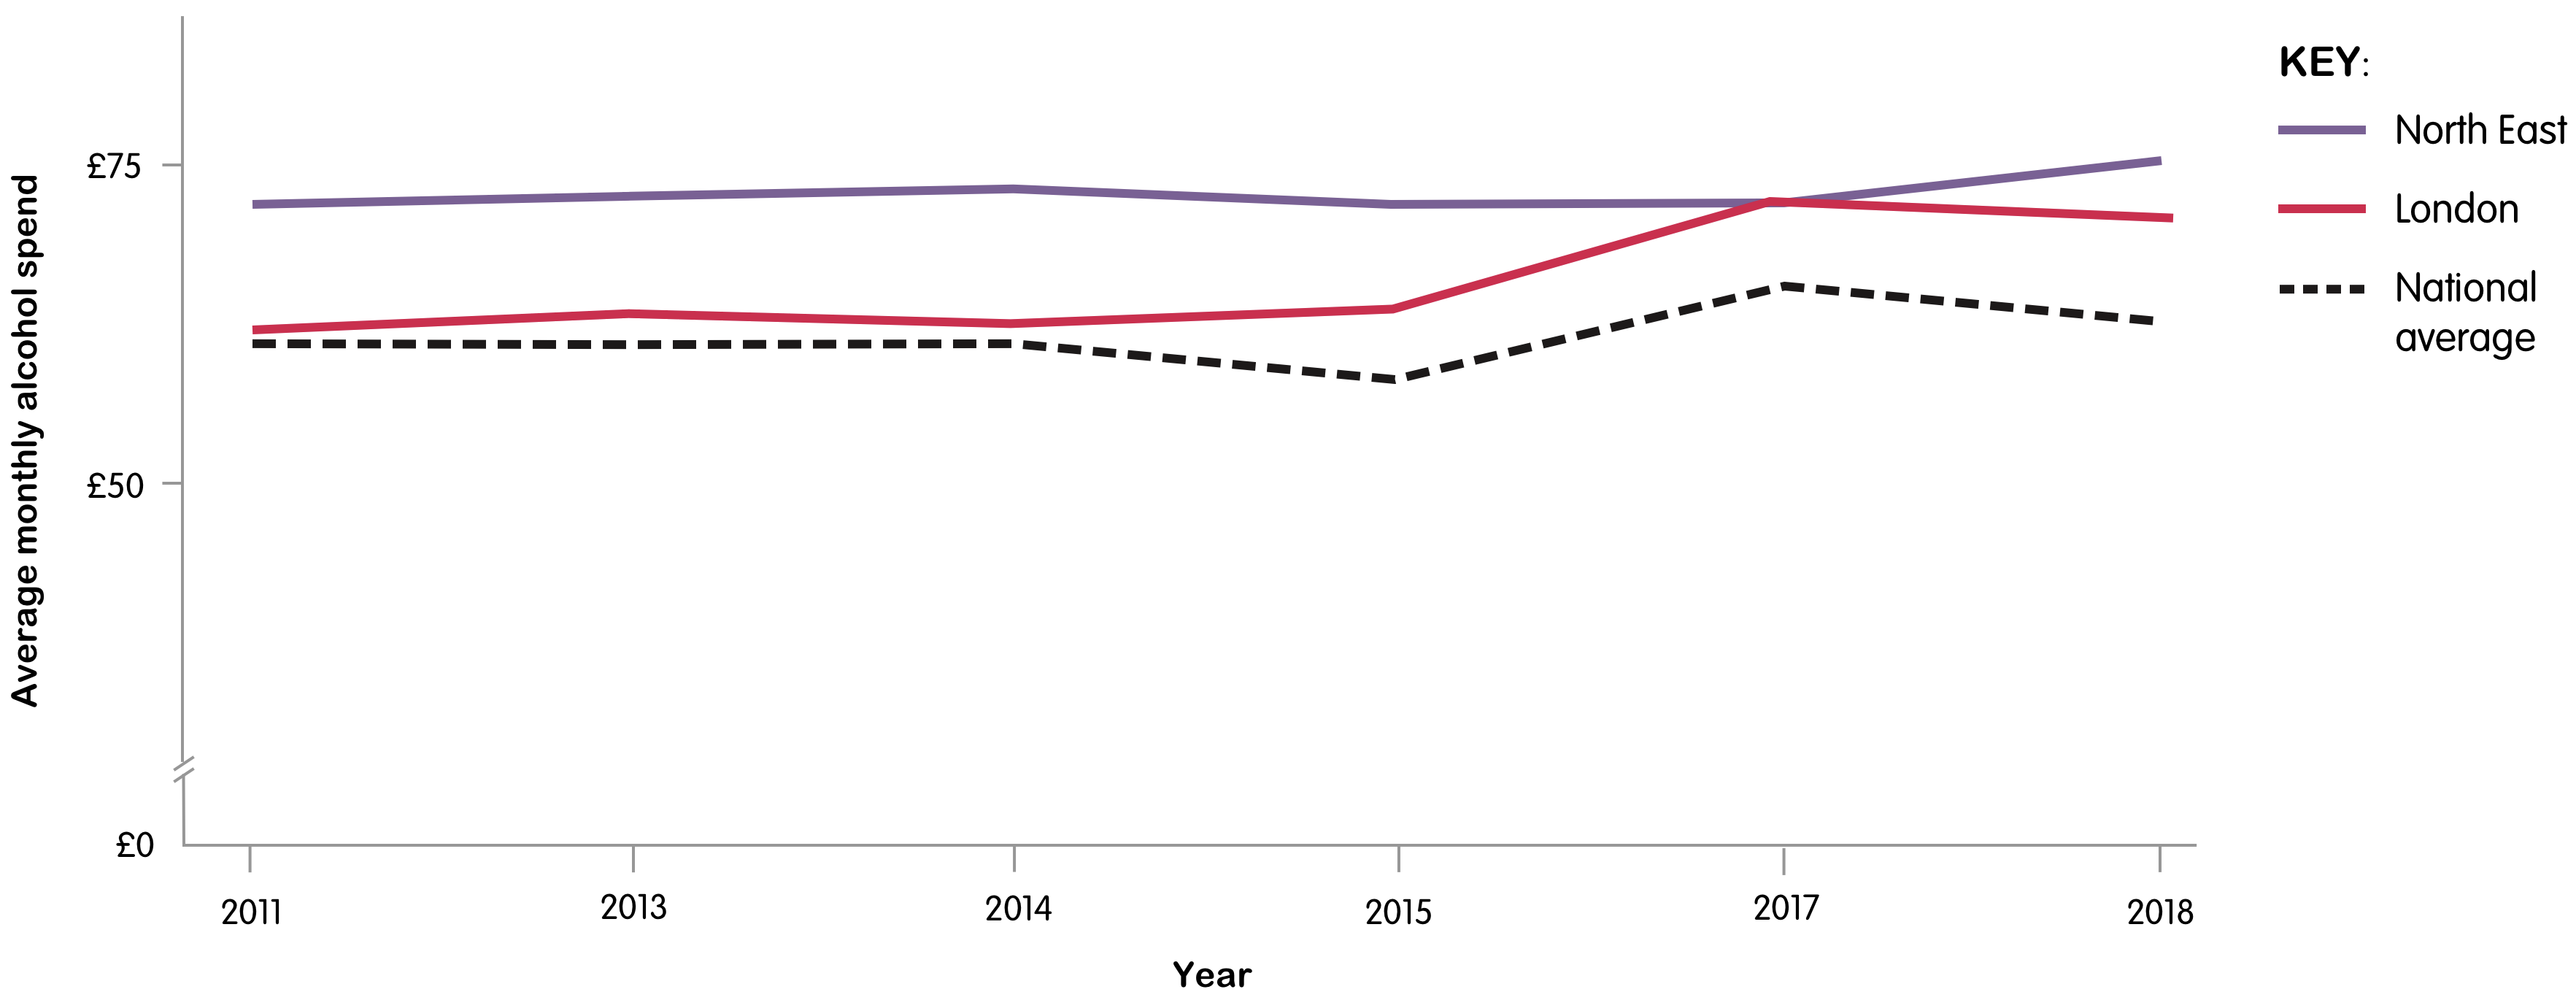
Y axis - Average monthly alcohol spend in £
X axis - By year
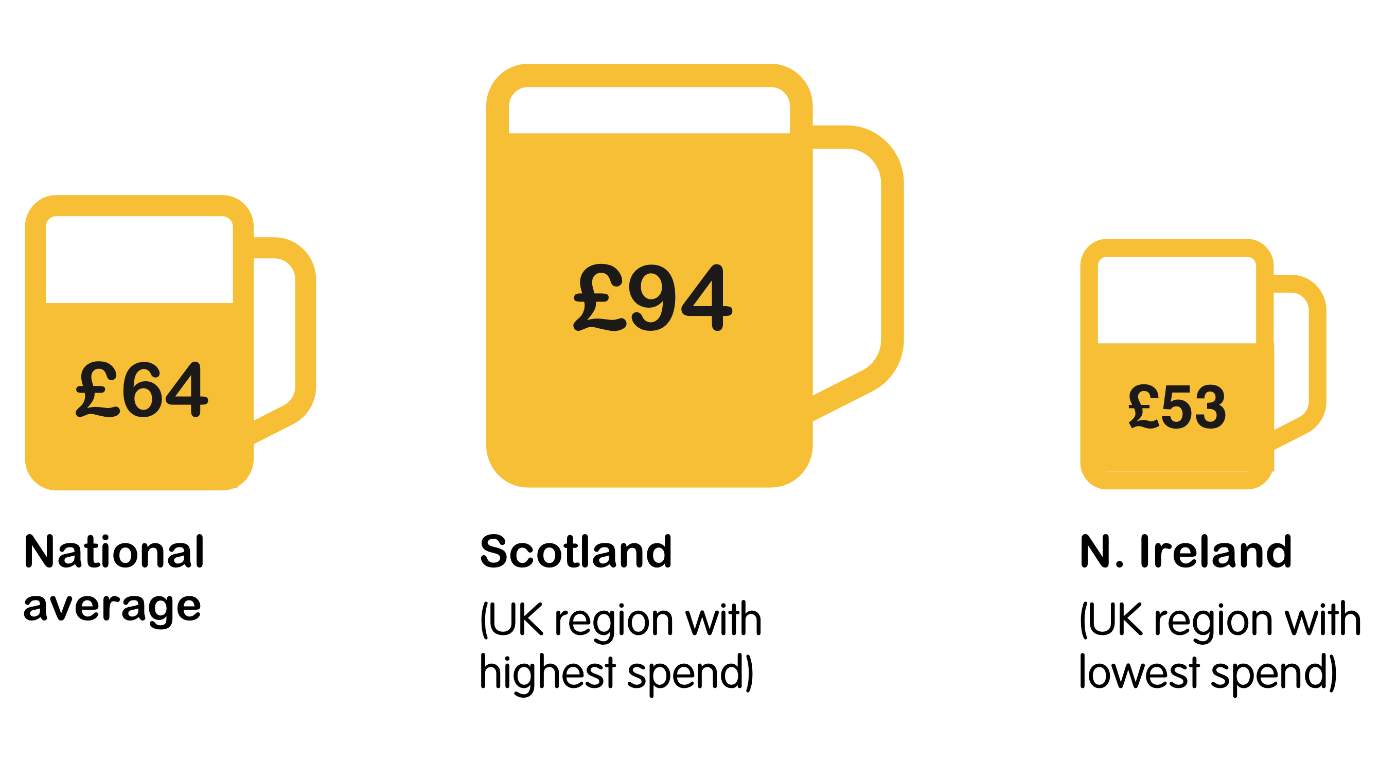
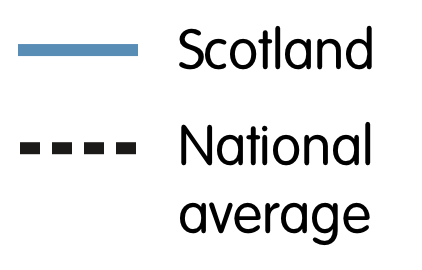
Scotland saw a big jump in 2014
This year happened to be the year of the Independence Vote, and spend was £30 more than the national average!
Scotland saw a big jump in 2014
This year happened to be the year of the Independence Vote, and spend was £30 more than the national average!
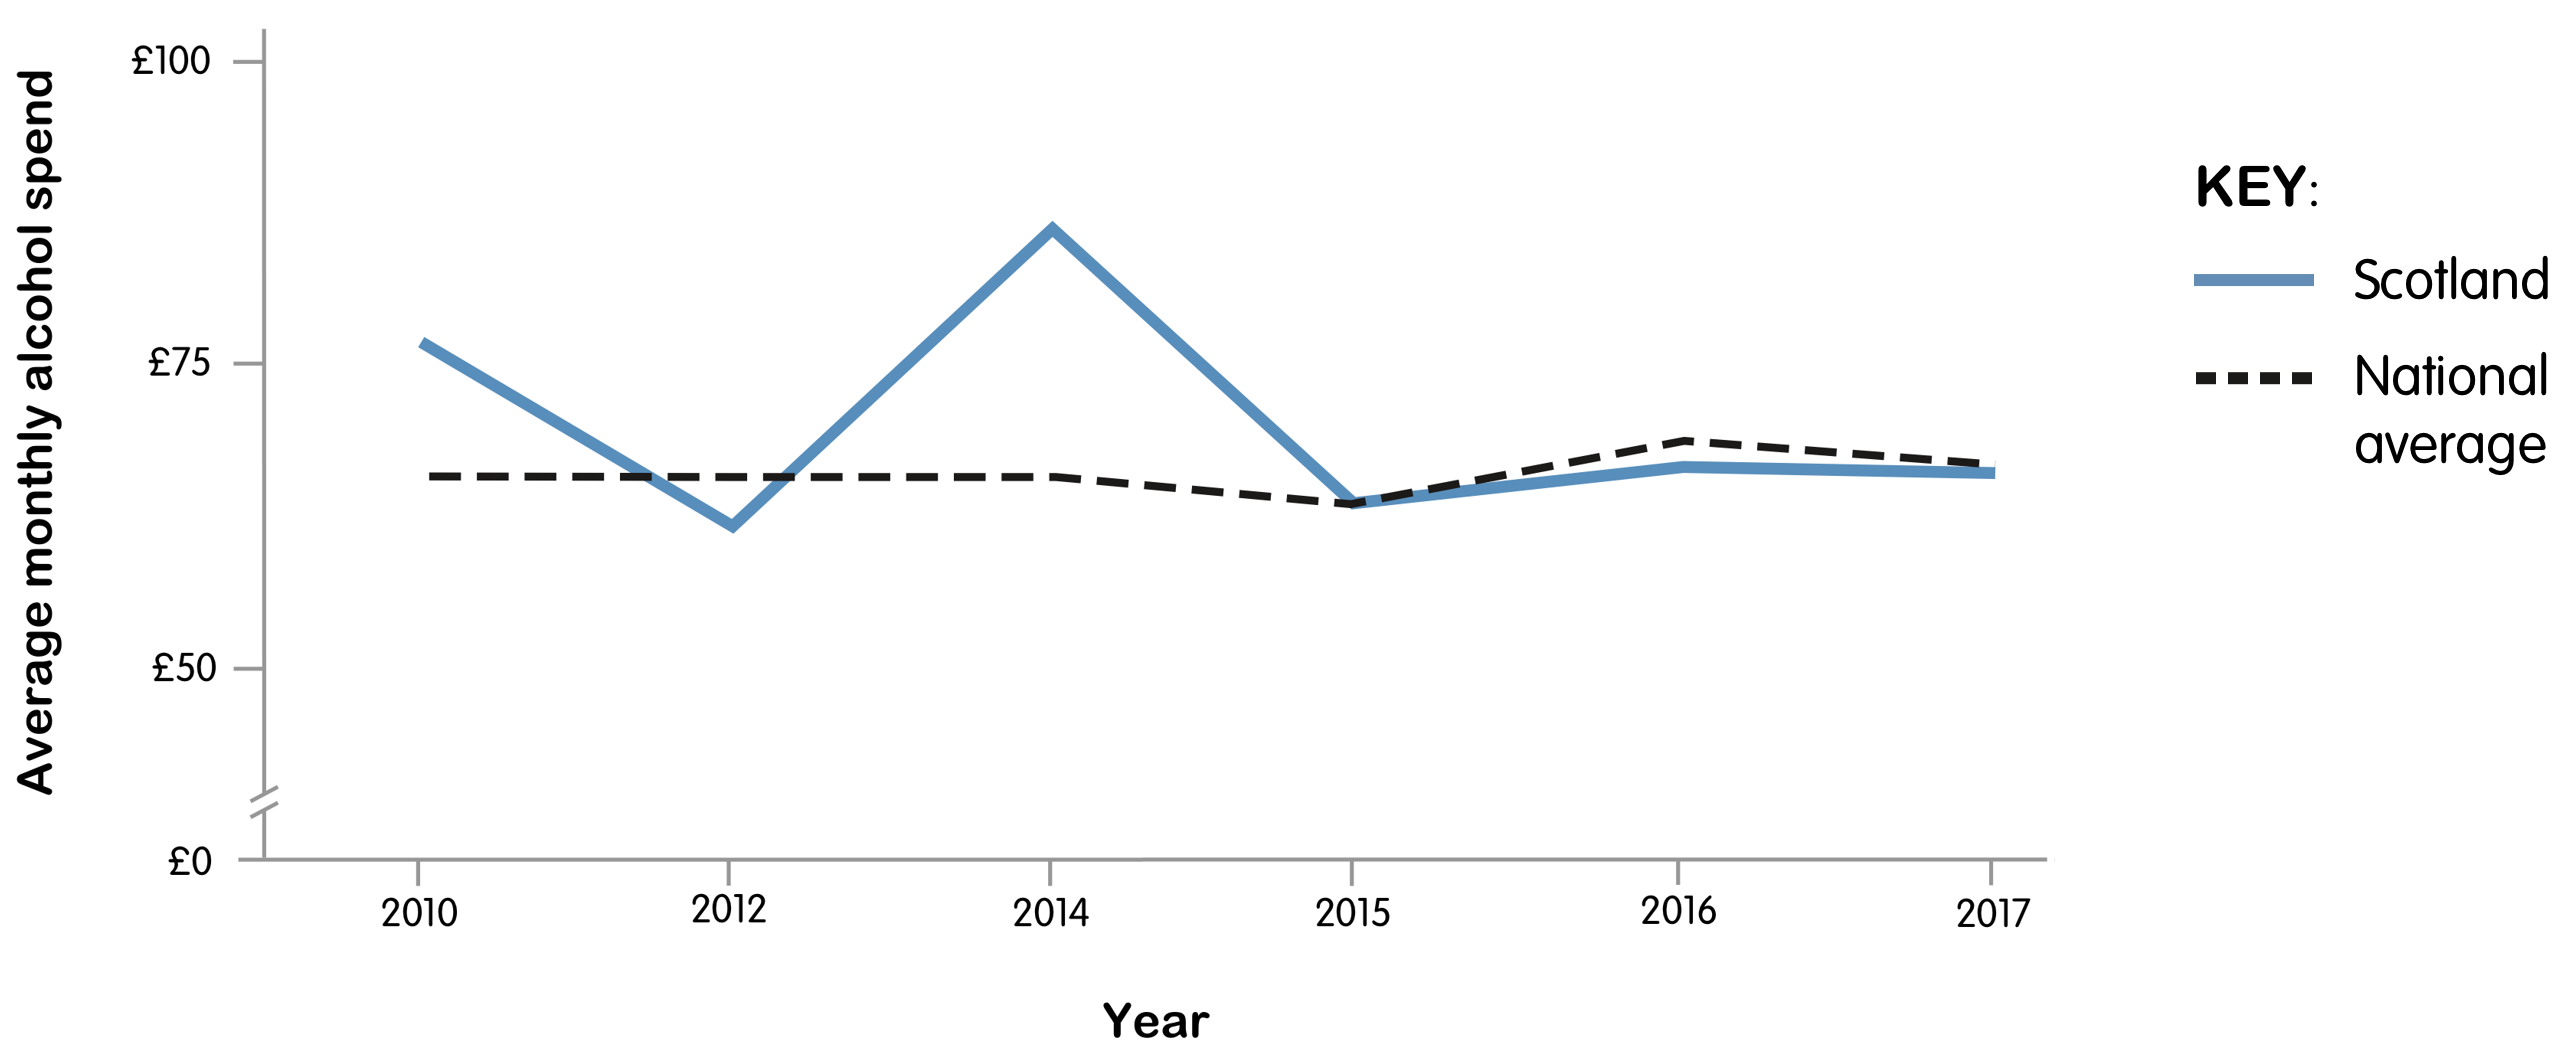
Monthly spend on Alcohol in 2014
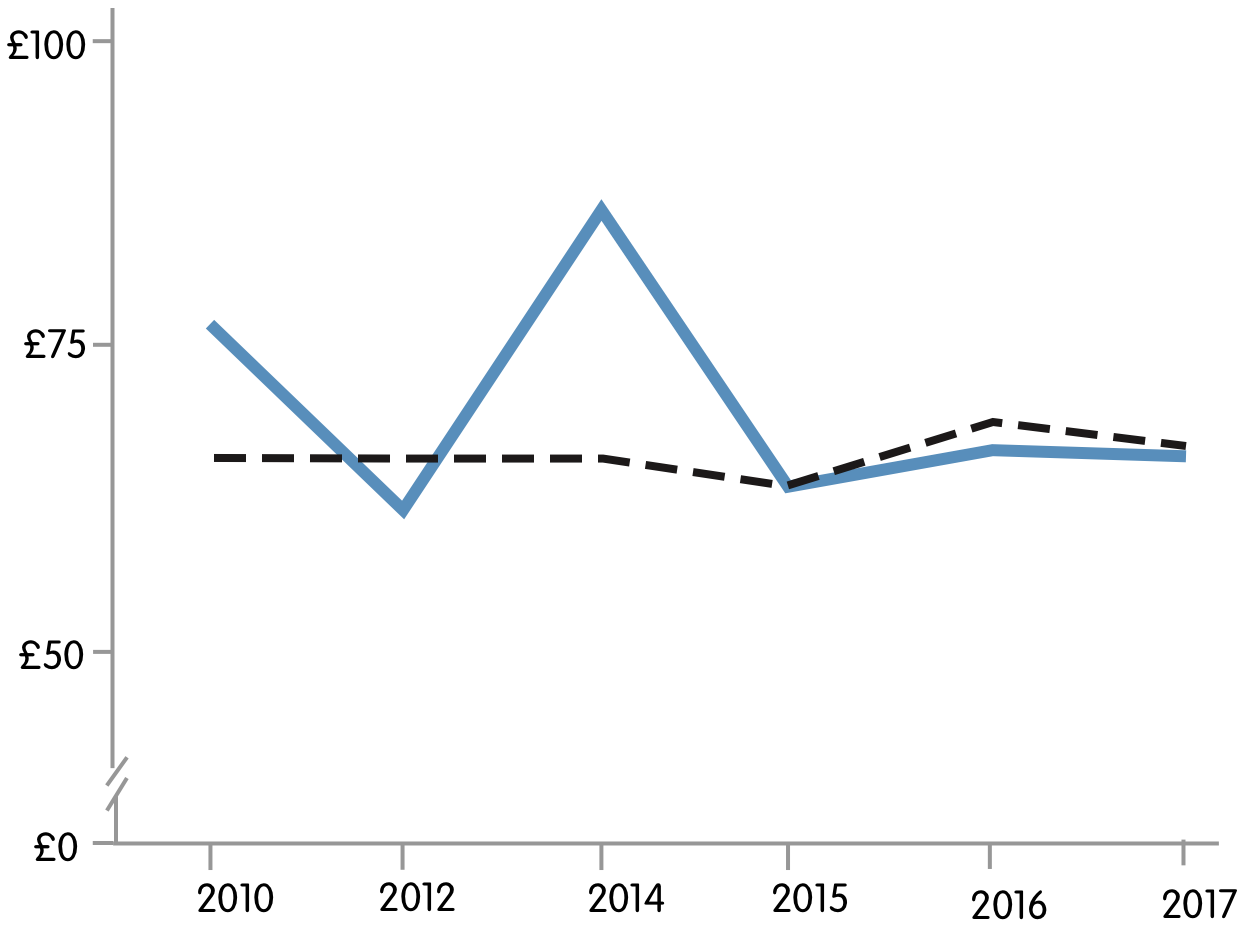
Y axis - Average monthly alcohol spend in £
X axis - By year
Monthly spend on Alcohol in 2014