Understanding Society builds on its predecessor project, the British Household Panel Survey (BHPS).
Many design features, instruments, and questions from the BHPS were continued in Understanding Society, allowing analysts to combine data from the two datasets. The active BHPS sample were incorporated into Understanding Society from Wave 2 onwards. Since 2017, a harmonised version of the two surveys has been released to make this easier.
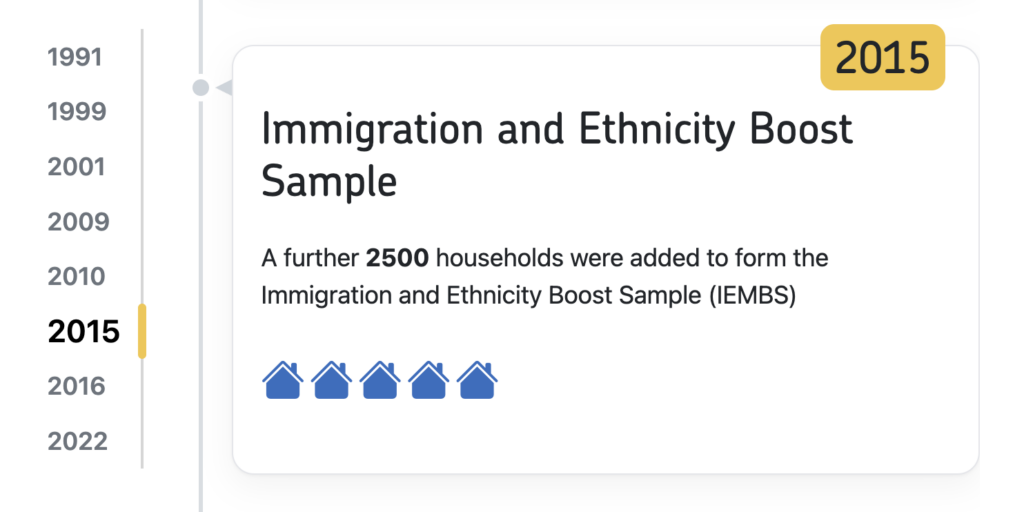
Survey Evolution:
The Survey Evolution timeline shows when each sample was added to the study.
Sample members are interviewed every year as long as they continue to live in the UK and can be located, contacted and agree to participate. The sample is issued in monthly batches across 24 months for the GPS-GB, GPS2-GB and EMBS, but across the first 12 months for GPS-NI, GPS2-NI and BHPS, and across the last 12 months for IEMBS. From 1991-2009, the BHPS fieldwork period was from September to December of each year.
Although GPS-GB and EMBS samples are in the field for over 24 months, every individual is interviewed at approximately 12 month intervals. So, for any individual their Wave 2 interview will be approximately one year after their Wave 1 interview, and their Wave 3 interview will be around 1 year after their Wave 2 interview (and two years after their Wave 1 interview) and so on.
These two aspects result in overlapping fieldwork periods, i.e., in any year interviews for two consecutive waves are conducted. In 2010, part of the GPS and EMBS samples were interviewed for the first time (Wave 1, Year 2 sample) and part was interviewed for the second time (Wave 2, Year 1 sample), and so on. The same will apply for the GPS2-GB sample that was selected and interviewed for the first time in the 24 month period, 2022-23.
Tips for analysts:
To compare and analyse differences across two consecutive calendar years, you should use data from all the interviews conducted in those years across two waves. For example, if you want to compare 2010 and 2011, you will need to use data from Wave 1 and Wave 2 interviews that were conducted in 2010 and compare that data with the data from Wave 2 and Wave 3 interviews that were conducted in 2011.
Analysing changes during the pandemic; comparisons of calendar year data
The analysis guidance described above also apply to researchers interested in analysing changes during the pandemic (2020) compared to the pre-pandemic period (2019). To make it easier for researchers and analysts to conduct this type of analysis we have released a 2020 calendar year dataset (which includes interviews conducted in 2020 as part of Wave 11 and Wave 12). New cross-sectional calendar year datasets are planned for each subsequent year and are explained in the Data section under comparisons of calendar year data. These are available under a separate study number and meant to be used for cross-sectional analyses and trends.
Note that while you can produce the 2019 calendar year dataset by combining interviews conducted in 2019 as part of Wave 10 & 11, this dataset is available with the Covid-19 survey data, the new monthly (then bi-monthly) survey that was fielded to the main survey sample members from April 2020 to September 2021 to understand the impact of the pandemic on people’s lives.


